Is Nvidia's Meteoritic Rise Over?
Let's follow the clues as we go over the charts.
You've reached your free article limit
You've read 0 of 1 free Pro articles.
Semiconductor manufacturer Nvidia's NVDA dramatic rise in the past couple of years probably allowed a few people to retire early but that historic rise may be reversing.
Let's check out the charts and indicators.
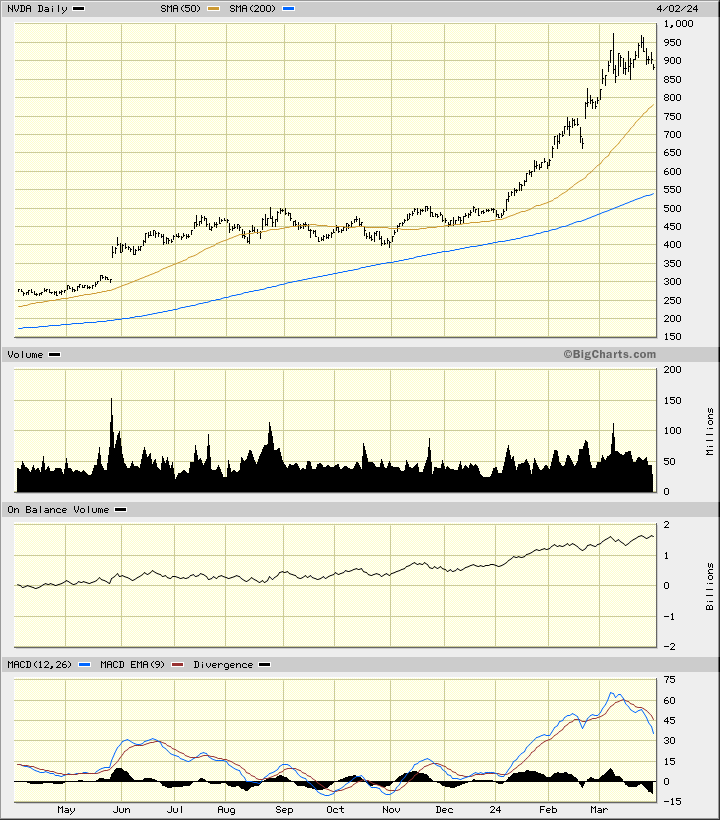
In this daily bar chart of NVDA, below, the casual observer of price action may be concerned. Prices are still in an uptrend and trades above the rising 50-day moving average line and the rising 200-day moving average line. Prices are extended (overbought) above the 200-day line as they nearly reached twice the value of the 200-day line.
NVDA made a consolidation pattern around the $450 level from July to January and prices reached $900 in March or a double of the consolidation pattern. Traders often think of doubling their money and buyers of NVDA got that opportunity.
The trading volume declined in March and the On-Balance-Volume (OBV) line stalled while prices made new highs. This move to new highs on weaker volume is not a positive development. The turn lower for the Moving Average Convergence Divergence (MACD) oscillator is another problem for the bulls.
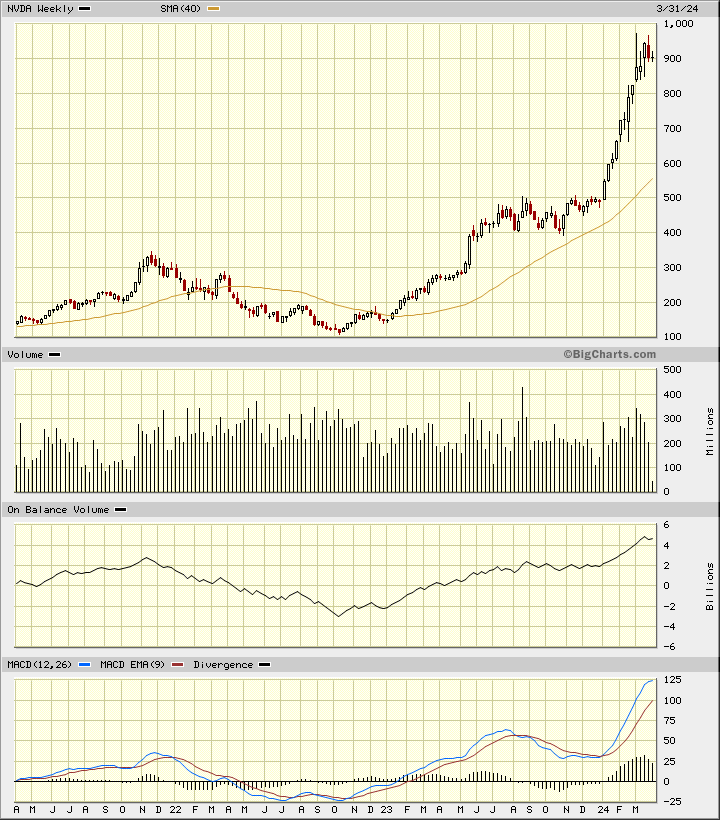
In this weekly Japanese candlestick chart of NVDA, below, I can see a nine-fold advance in price from the nadir in the fourth quarter of 2022. Incredible. Prices trade above the rising 40-week moving average line.
The weekly OBV line has been rising but we have a hint at a downside reversal in March.
The MACD oscillator has been narrowing, telling us that the "trend strength" is weakening. The most recent candle pattern is a doji or a small spinning top and could be part of a top reversal pattern.
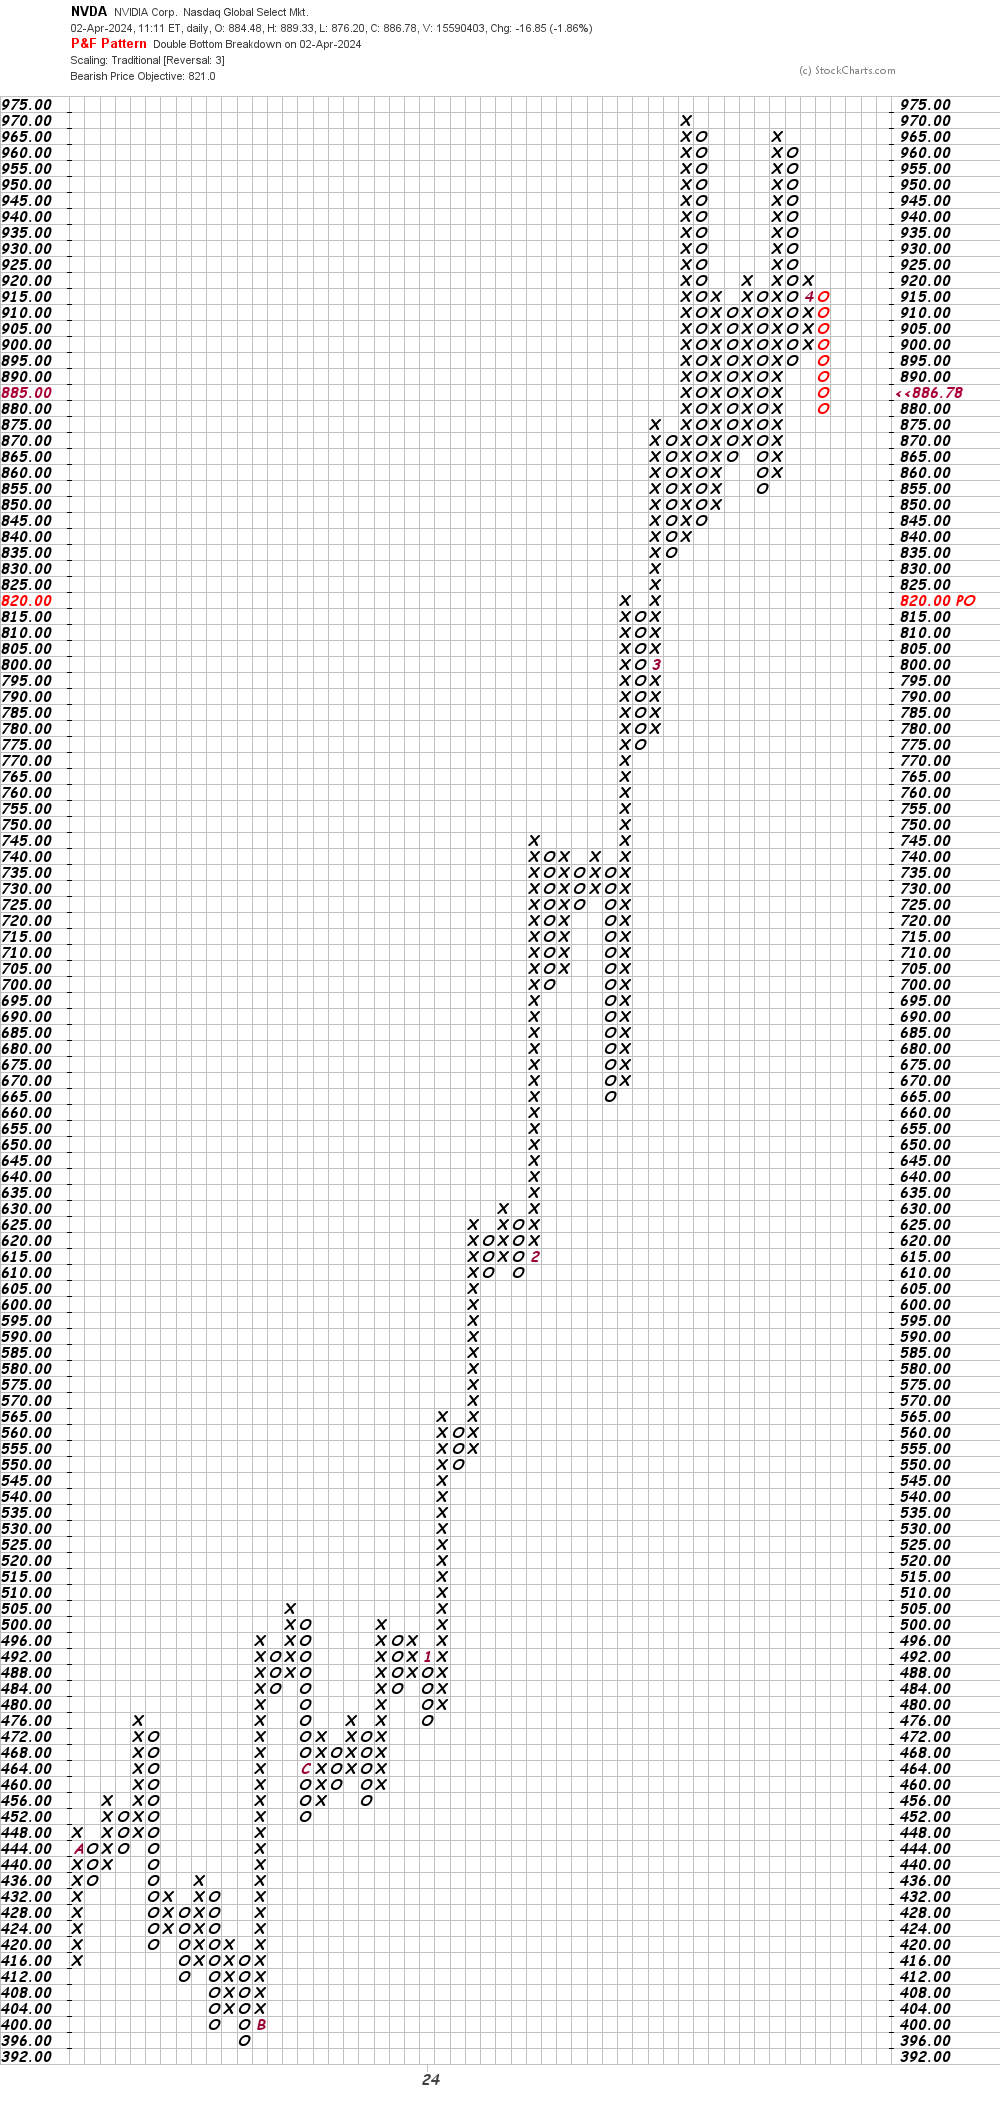
In this daily Point and Figure chart of NVDA, below, I can see a downside price target in the $821 area.
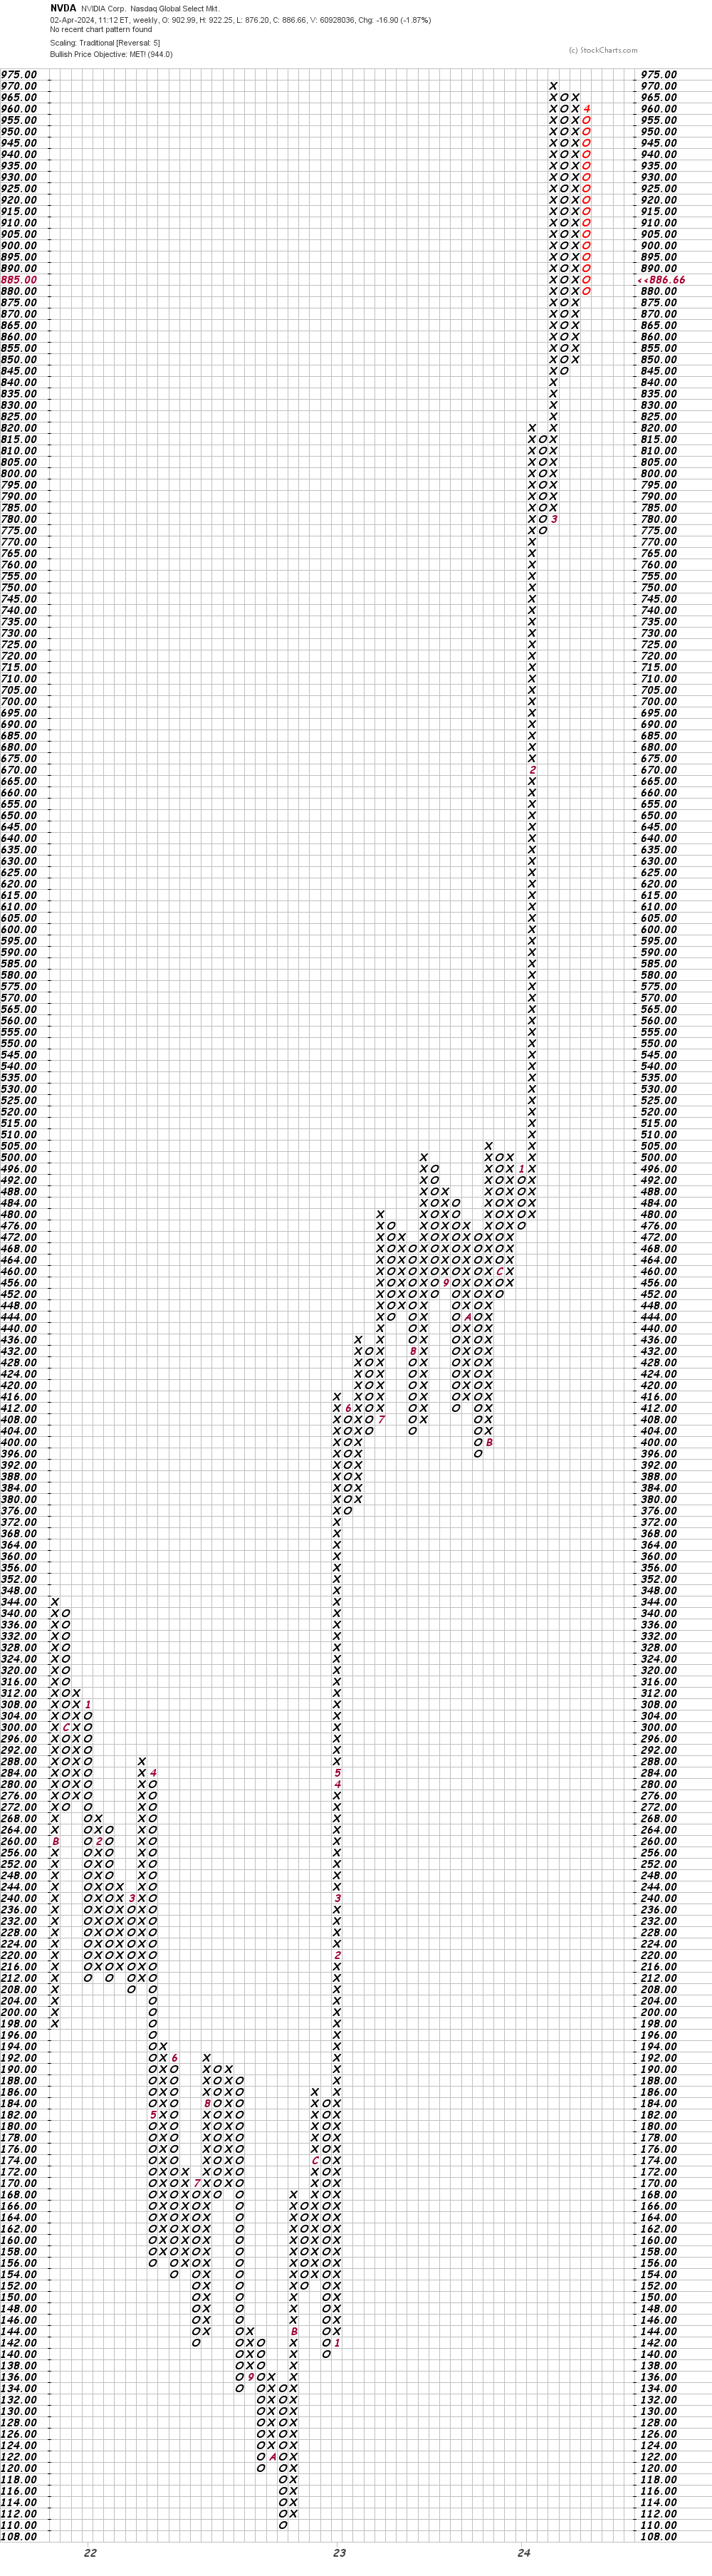
In this weekly Point and Figure chart of NVDA, below, I used a five box reversal filter. Here the software tells us that prices reached a price target in the $944 area.
Have technically oriented traders of NVDA taken profits in the $944 area? Maybe.
Bottom line strategy: NVDA was a "leadership" stock on its way north and now it might become a leadership stock on its way south. Don't fight the tape is my best advice at this point in time.
Employees of TheStreet are prohibited from trading individual securities.