Is It Stop or Go for Union Pacific?
Let's hop aboard and see what signal is ahead for the railroad stock.
You've reached your free article limit
You've read 0 of 1 free Pro articles.
Union Pacific Corp. UNP has been on an upswing the past two months. Will we see UNP breakout over its February highs or fail and retreat?
Let's drill down on the charts and indicators.
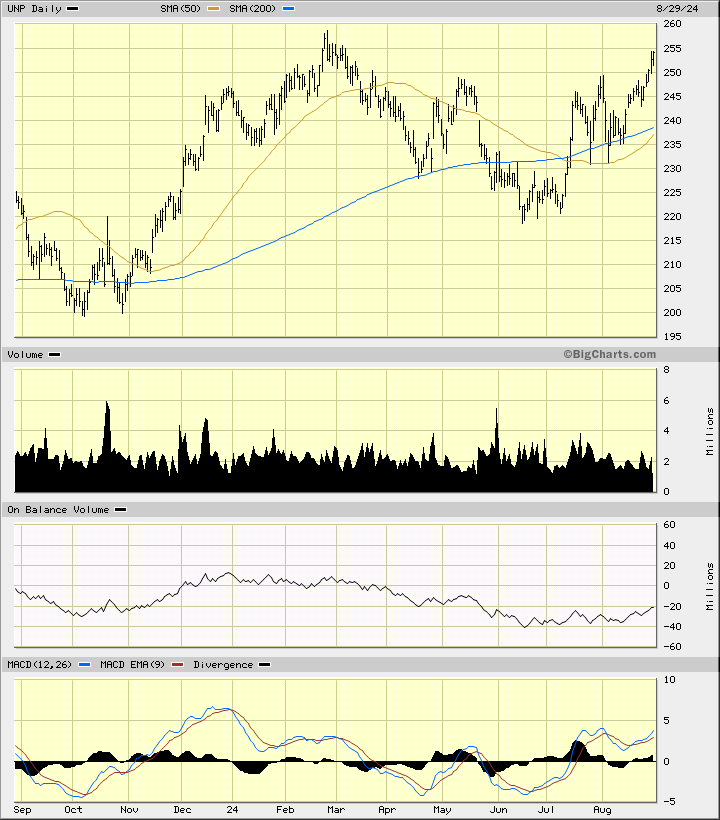
In the daily bar chart of UNP, below, I can see that the shares are trading higher and above the rising 50-day moving average line and above the rising 200-day line. Unfortunately the trading volume has not increased on the most recent two-month advance. The daily On-Balance-Volume (OBV) line only shows me a slight increase and not a more robust one.
The Moving Average Convergence Divergence (MACD) is in a bullish alignment above the zero line.
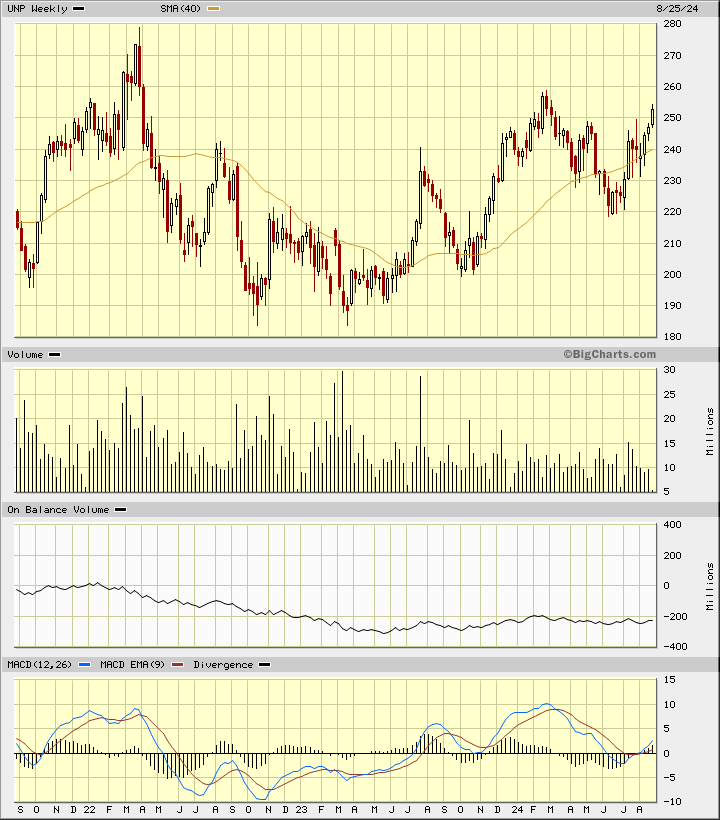
In the weekly Japanese candlestick chart of UNP, below, I see a mixed picture. The shares look somewhat capable of retesting the February high but the high in early 2022 looks like a pretty high bar. Prices are trading above the rising 40-week moving average line.
The weekly volume histogram is neutral. The weekly OBV line has not matched or confirmed the price action in the past two years. The MACD oscillator has just recently crossed above the zero line.
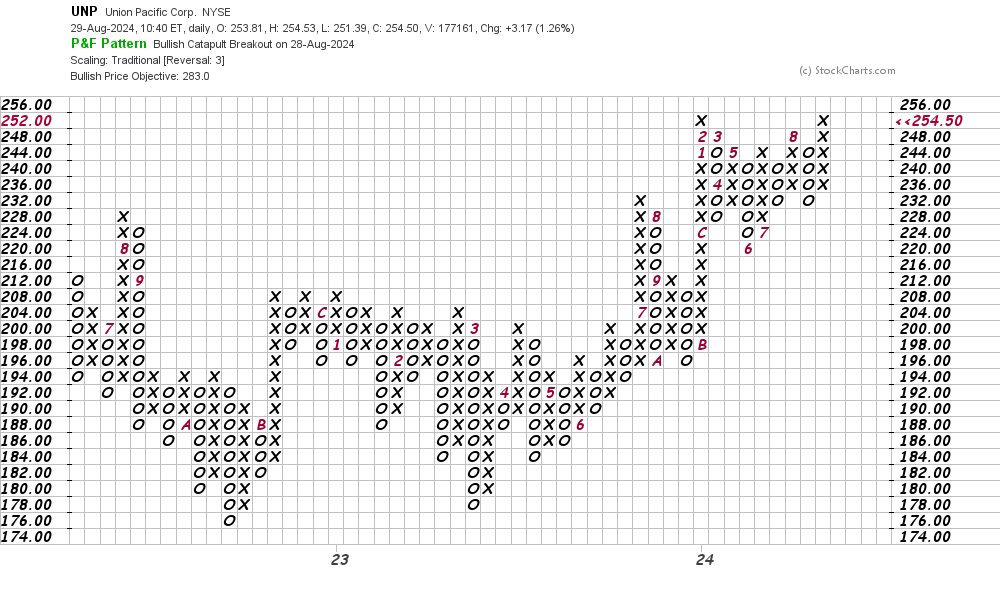
In this daily Point and Figure chart of UNP, below, I can see a potential upside price target in the $283 area. A trade at $256 or higher is needed to refresh the uptrend.
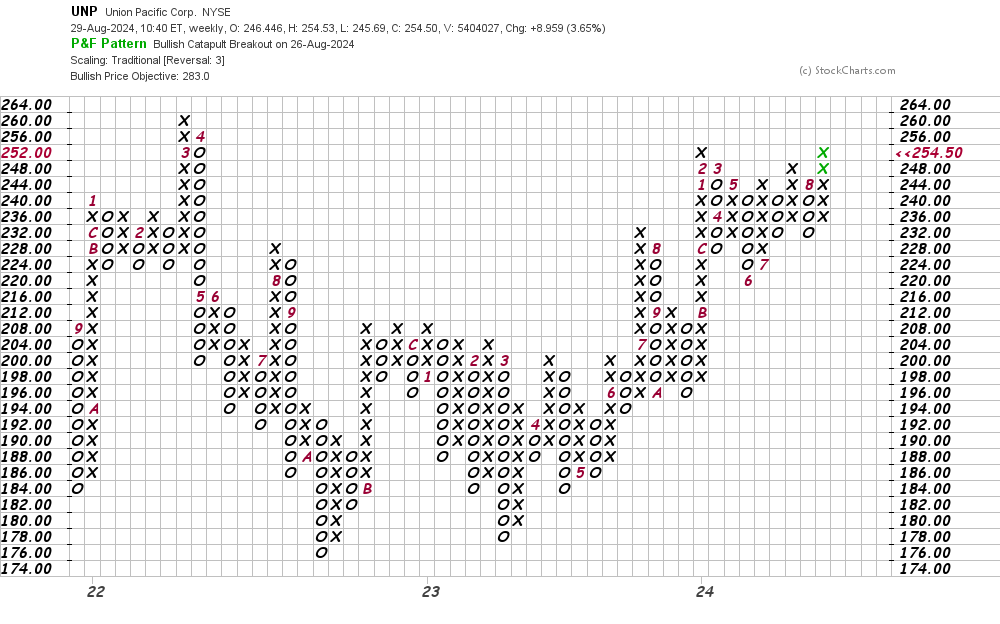
In this weekly Point and Figure chart of UNP, below, I can see the same $283 price target but here on this weekly chart a trade at $264 or higher is needed to refresh the uptrend.
Bottom-line strategy: Without a clear expansion of trading volume I am reluctant to get bullish on UNP. Meanwhile keep an open mind as conditions could change.
Employees of TheStreet are prohibited from trading individual securities.