When I Look Inside Intel's Charts, I See Something Good Ahead
As the company cuts staff, it looks set to bounce ... but not just yet.
You've reached your free article limit
You've read 0 of 1 free Pro articles.
News reports Wednesday say that Intel Corp INTC is going to eliminate thousands of jobs in a cost-cutting effort. Let's check out the charts and indicators to see if this can help the share price reverse its downtrend.
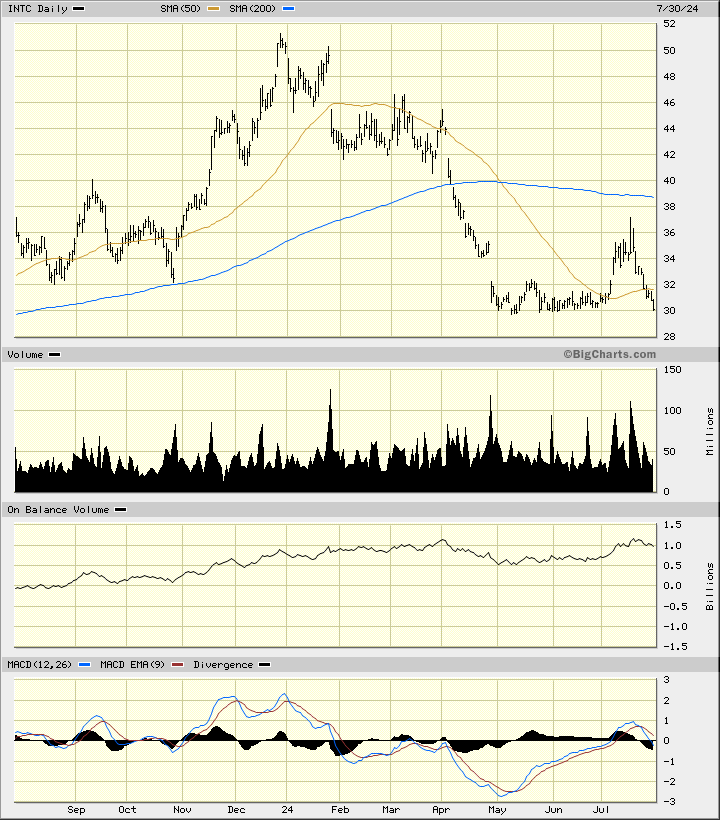
In this daily bar chart of INTC, below, I can see that prices have been testing and so far holding the $30 area or zone. Prices are currently below the 50-day moving average line and below the 200-day line. The trading volume has been more active the past three months suggesting more interest from investors. The On-Balance-Volume (OBV) line is slightly above the zero-line.
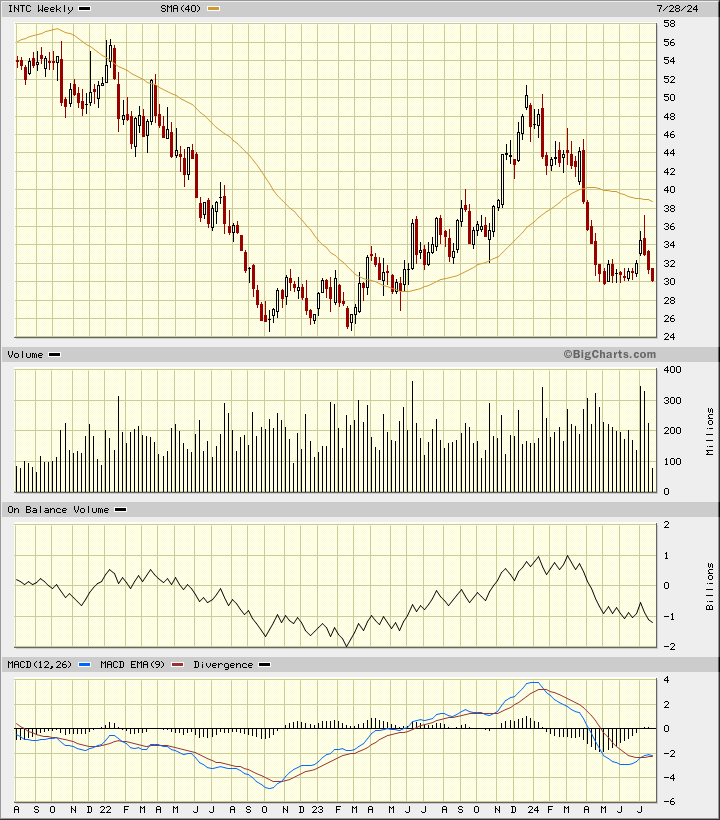
In this weekly Japanese candlestick chart of INTC, below, I still see a bearish setup. Prices trade below the declining 40-week moving average line. The weekly OBV line has moved to a new low for the move down and suggests that sellers of INTC have been more aggressive than buyers. The MACD oscillator is below the zero-line but trying to generate a cover shorts buy signal.
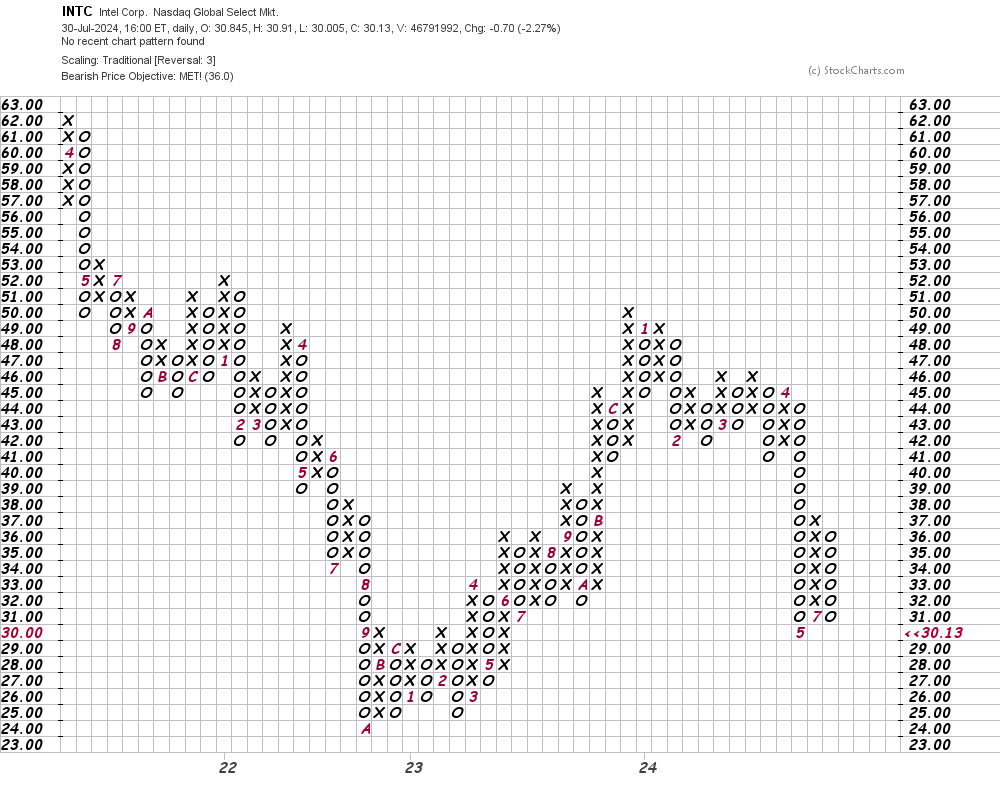
In this daily Point and Figure chart of INTC, below, I can see that prices have reached and exceeded a downside price target in the $36 area.
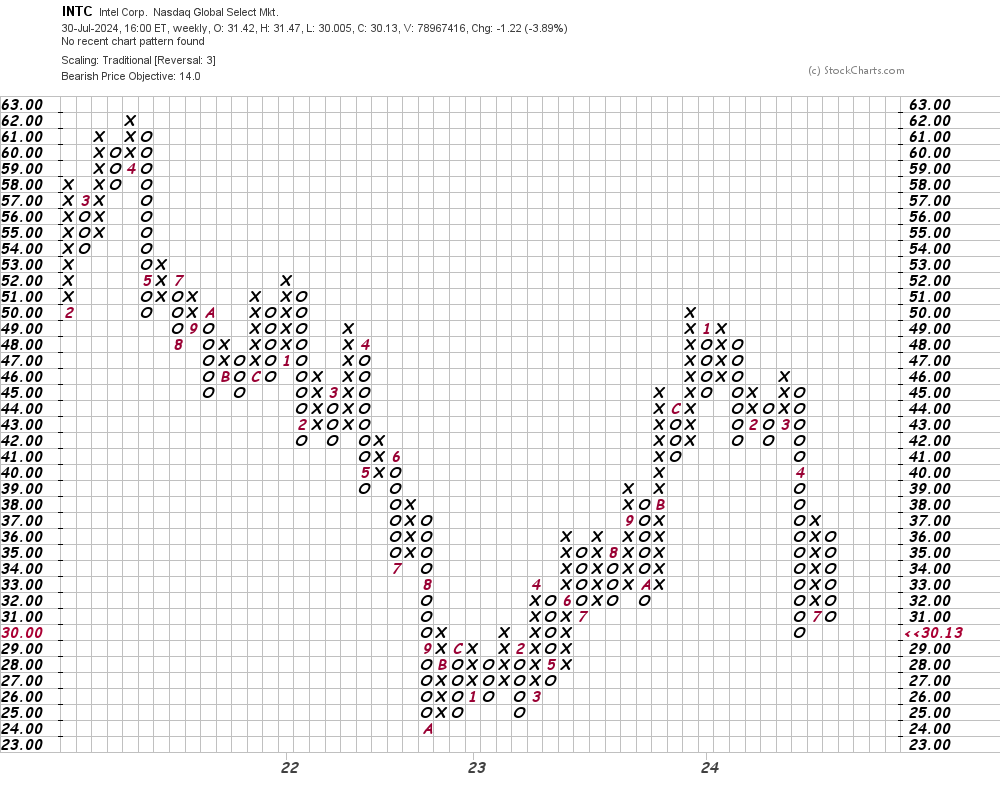
In this weekly Point and Figure chart of INTC, below, I can see a potential downside price target in the $14 area. It may take a trade at $38 to turn this chart bullish.
Bottom line strategy: INTC is set to bounce to the upside but more accumulation (buying) may be needed before INTC reverses its downward path.
Employees of TheStreet are prohibited from trading individual securities.