IBM's Up After Earnings Beat, but I'm Watching This Key Price Level
The computer name is climbing in premarket trading after releasing second-quarter earnings.
You've reached your free article limit
You've read 0 of 1 free Pro articles.
International Business Machines IBM reported an unadjusted earnings per share of $1.99 Thursday, which beat analyst estimates by $0.19 and revenue of $15.8 billion, which beat by $180 million.
The stock is trading higher in the premarket Thursday.
Let's check out the trends and indicators to see how things could trade from here.
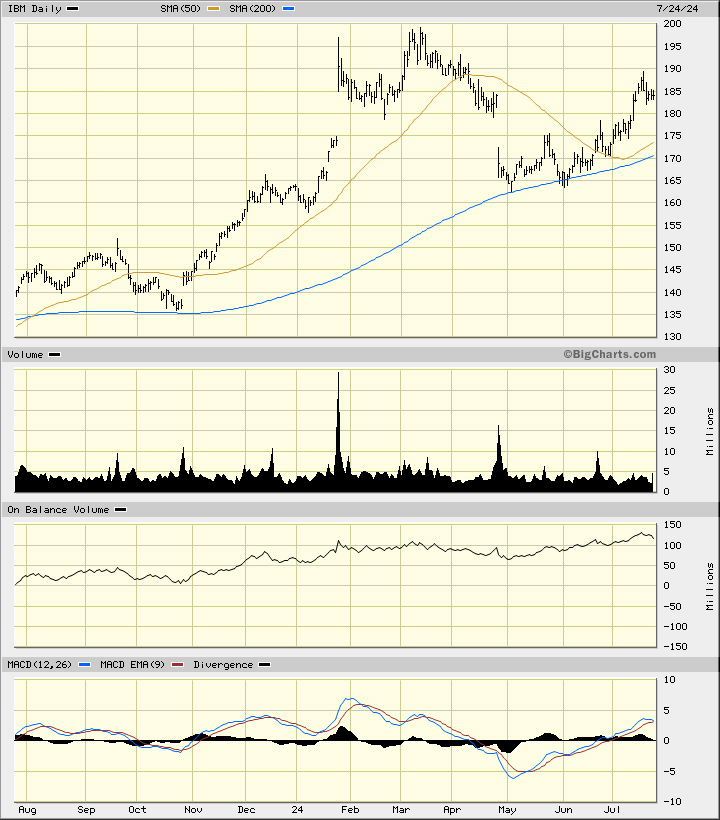
In this daily bar chart of IBM, below, I can see that shares of IBM made a strong rally from October to early March followed by a downside correction. Prices made a fresh bottom in May with successful tests of the rising 200-day moving average line. The slope of the shorter 50-day moving average line is also positive.
The On-Balance-Volume (OBV) line shows us a rising pattern the past 12 months with a slight dip in late July. The trend-following Moving Average Convergence Divergence (MACD) oscillator is above the zero-line but it narrowed in recent days suggesting that the power of the uptrend was weakening.
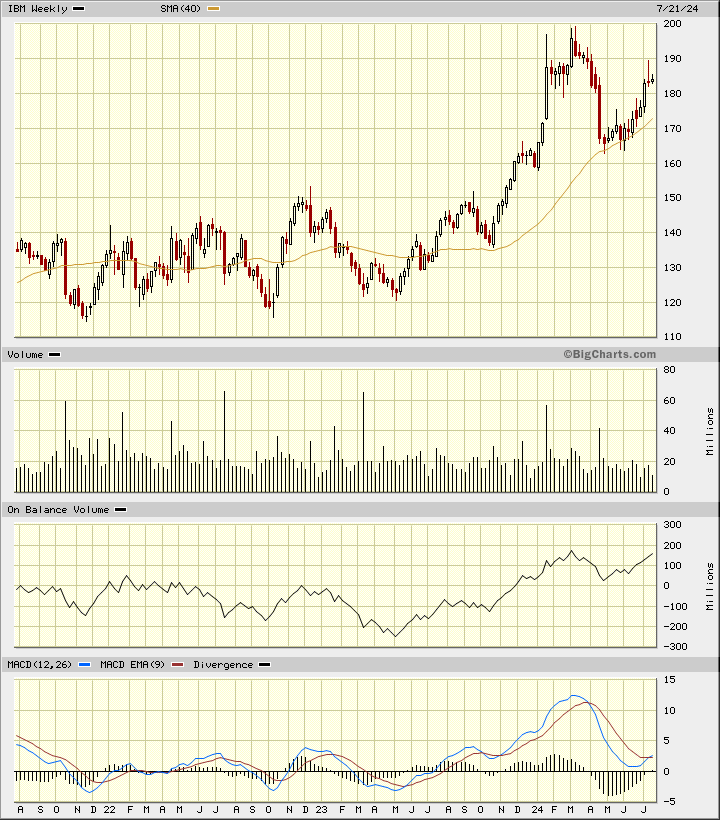
In this weekly Japanese candlestick chart of IBM, below, I can see that prices made a good sized base pattern starting back in 2022.
Prices broke out on the upside in late 2023 and now trade above the rising 40-week moving average line. The most recent candle patterns show us that traders rejected the highs so IBM needs to close above the top of the upper shadow to refresh the uptrend. The weekly OBV line is strong and the MACD oscillator is improving toward a new buy signal. The only clue that is missing is that volume has not expanded on the advance in the past three or four months.
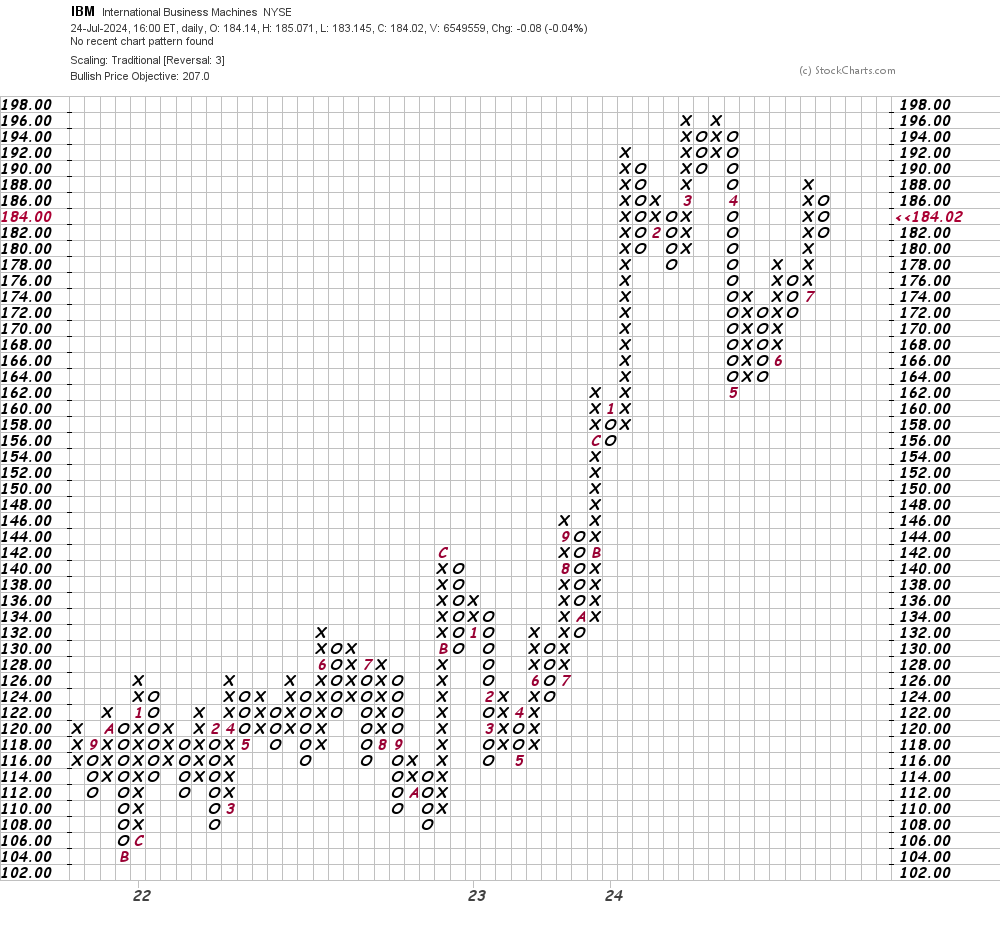
In this daily Point and Figure chart of IBM, below, I can see that the software is projecting an upside price target in the $207 area. A trade at $198 is needed to refresh the uptrend.
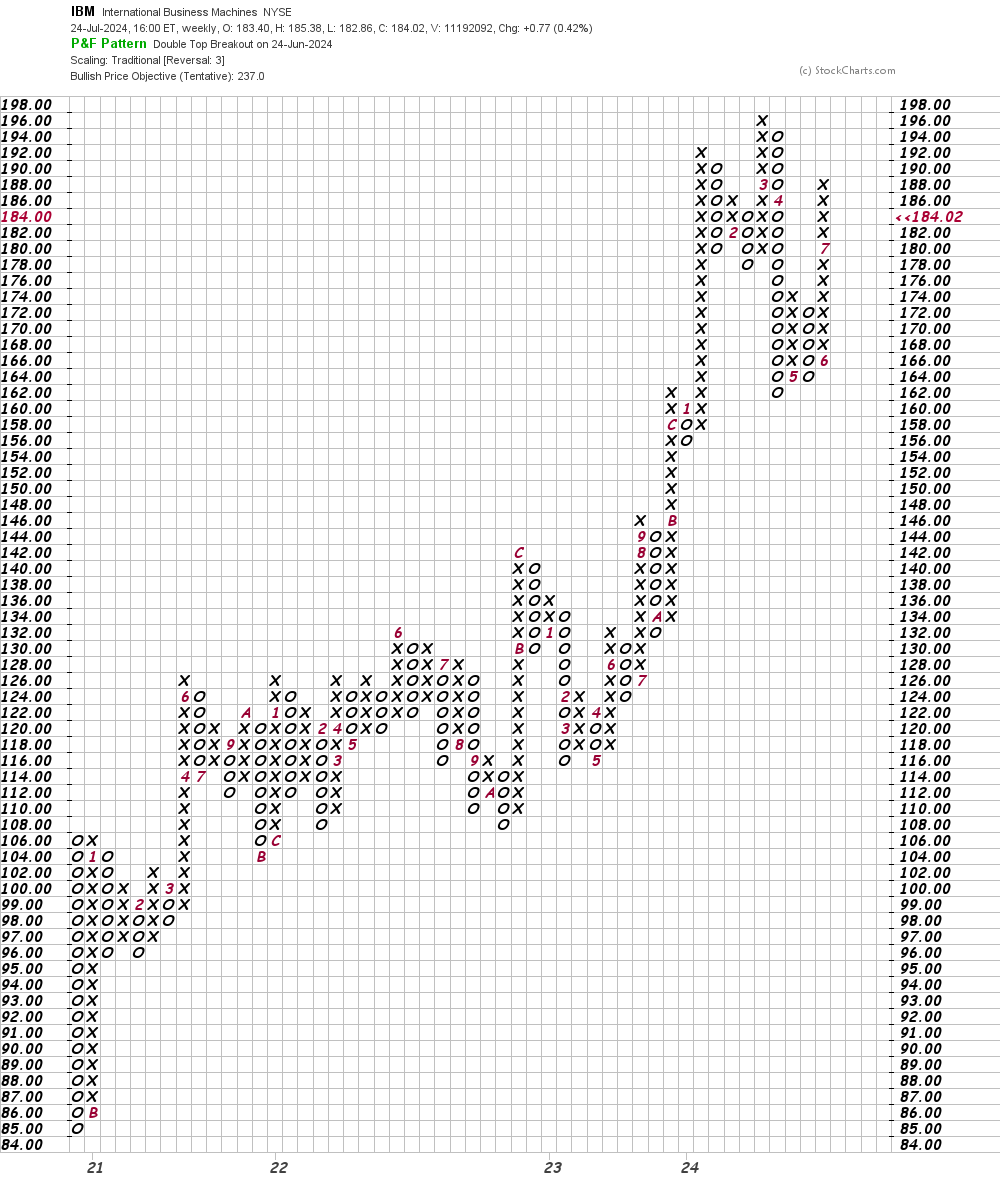
In this weekly Point and Figure chart of IBM, the price target reaches $237 but here too we need a trade at $198 to refresh the uptrend.
Bottom line strategy: Shares of IBM are higher in the pre-market Thursday but the charts above tell me to not get too excited until we get strength above $198.
Employees of TheStreet are prohibited from trading individual securities.