IBM's Charts Look a Bit Blue Ahead of Big Blue's Earnings
The shares of the technology giant have been weakening of late and that trend could continue once IBM's results are out next week.
You've reached your free article limit
You've read 0 of 1 free Pro articles.
International Business Machines Corp. IBM is not expected to report first-quarter results until April 24 after the market close. However, prices of the technology giant turned lower in early March. Does this decline reflect forward-looking investors adjusting their positions or is it the result of broad market weakness? Let's check out the charts and indicators of IBM, which I last reviewed on Jan. 25.
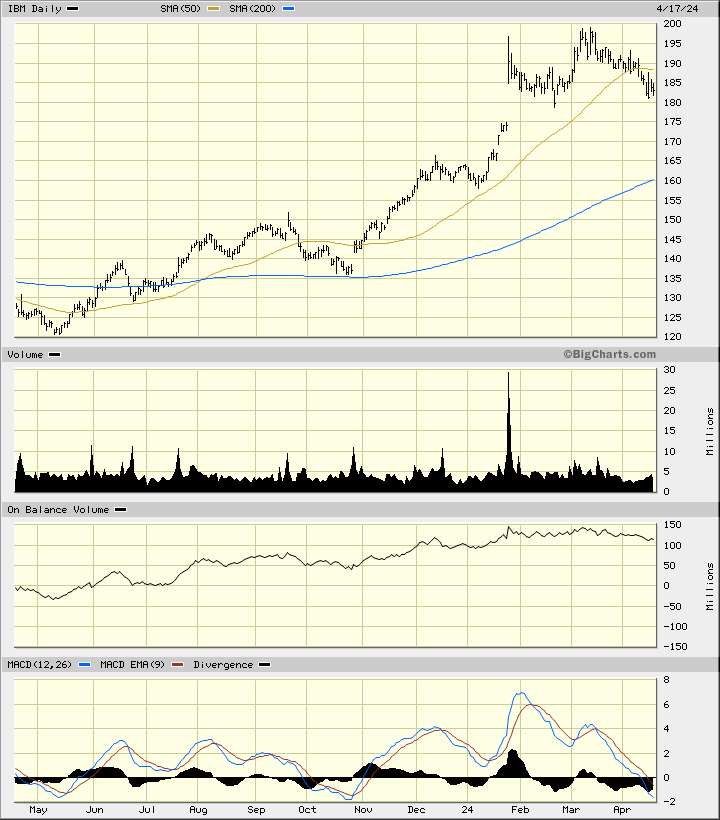
In this daily bar chart of IBM, below, I can see that prices are now trading below the declining 50-day moving average line. Math tells us that the short-term trend is bearish. The slope of the slower-to-react 200-day moving average line is still positive and intersects down around $160. The On-Balance-Volume (OBV) line moved sideways in February and began to decline in March as traders shifted toward becoming more aggressive sellers than buyers. The trend-following Moving Average Convergence Divergence (MACD) oscillator turned lower in early February and is now below the zero line in sell territory.
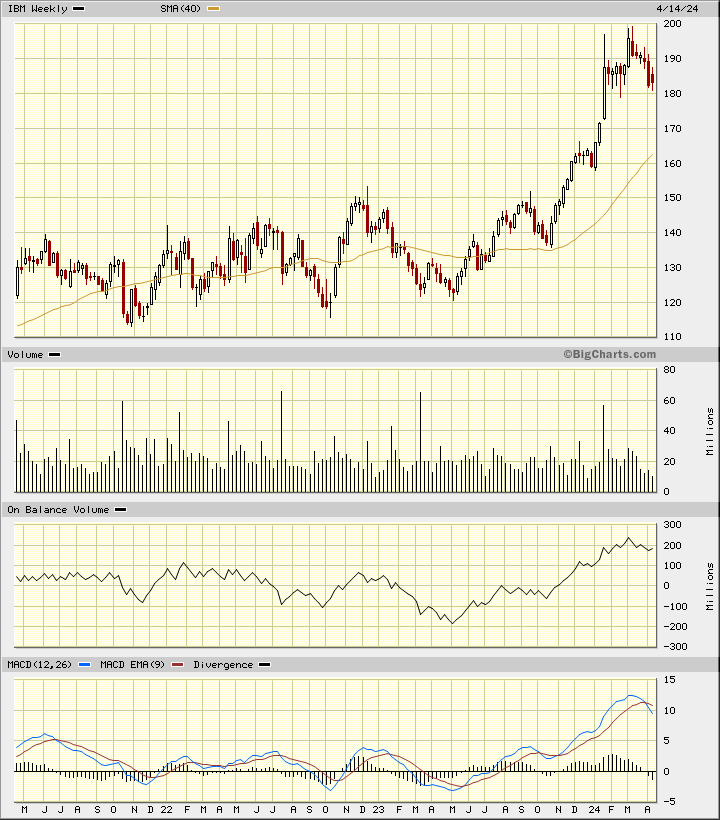
In this weekly Japanese candlestick chart of IBM, below, I see a vulnerable setup. The candles so far this year show us a number of upper shadows as traders rejected the highs. Lower shadows on candles in February are not providing much support and a close below $180 will weaken this chart even further. The slope of the 40-week moving average line is bullish but this is a lagging indicator. The weekly OBV line shows us a turn to the downside in March. The MACD oscillator has crossed to the downside for a take profits sell signal.
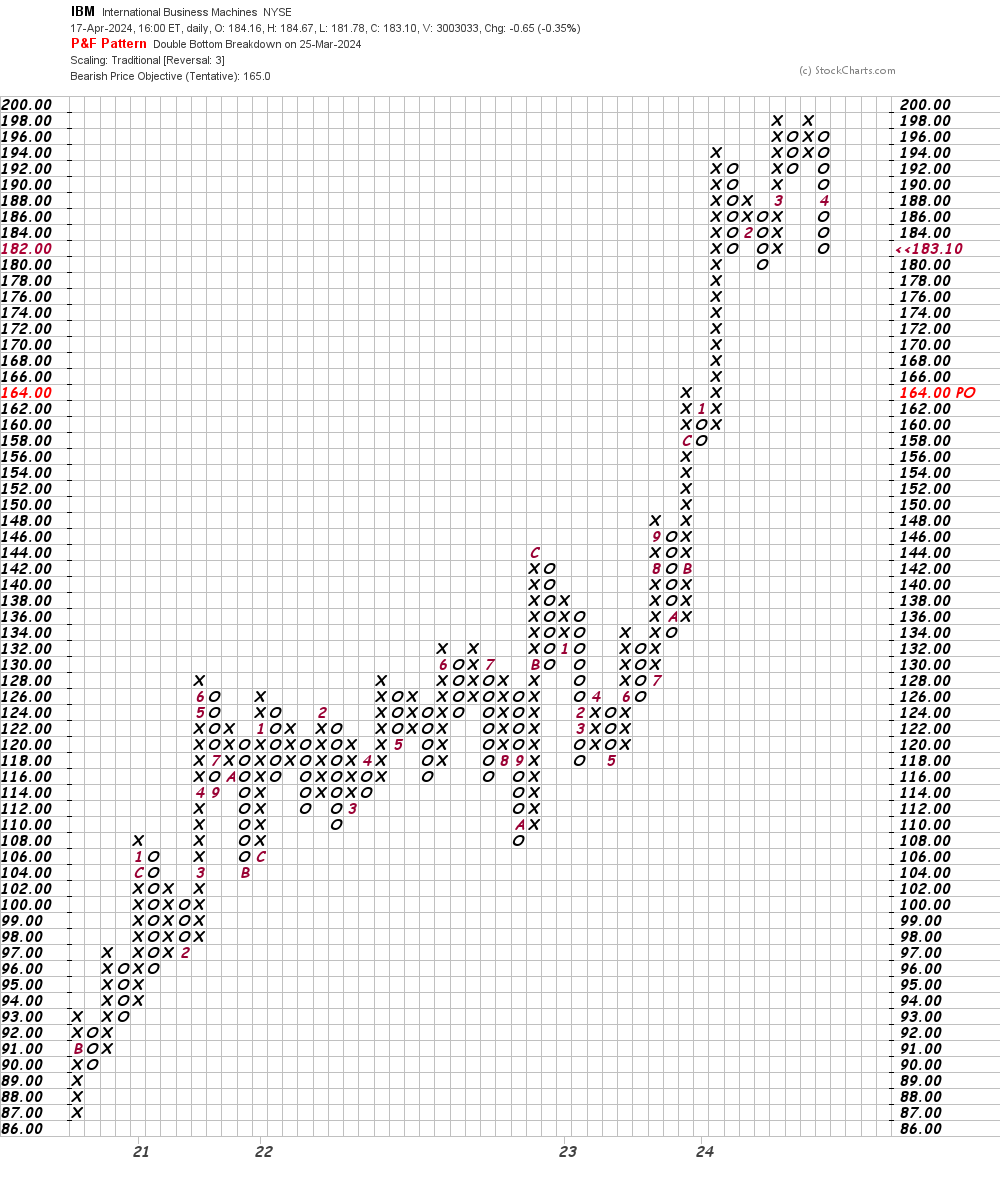
In this daily Point and Figure chart of IBM, below, I can see a potential downside price target in the $165 area.
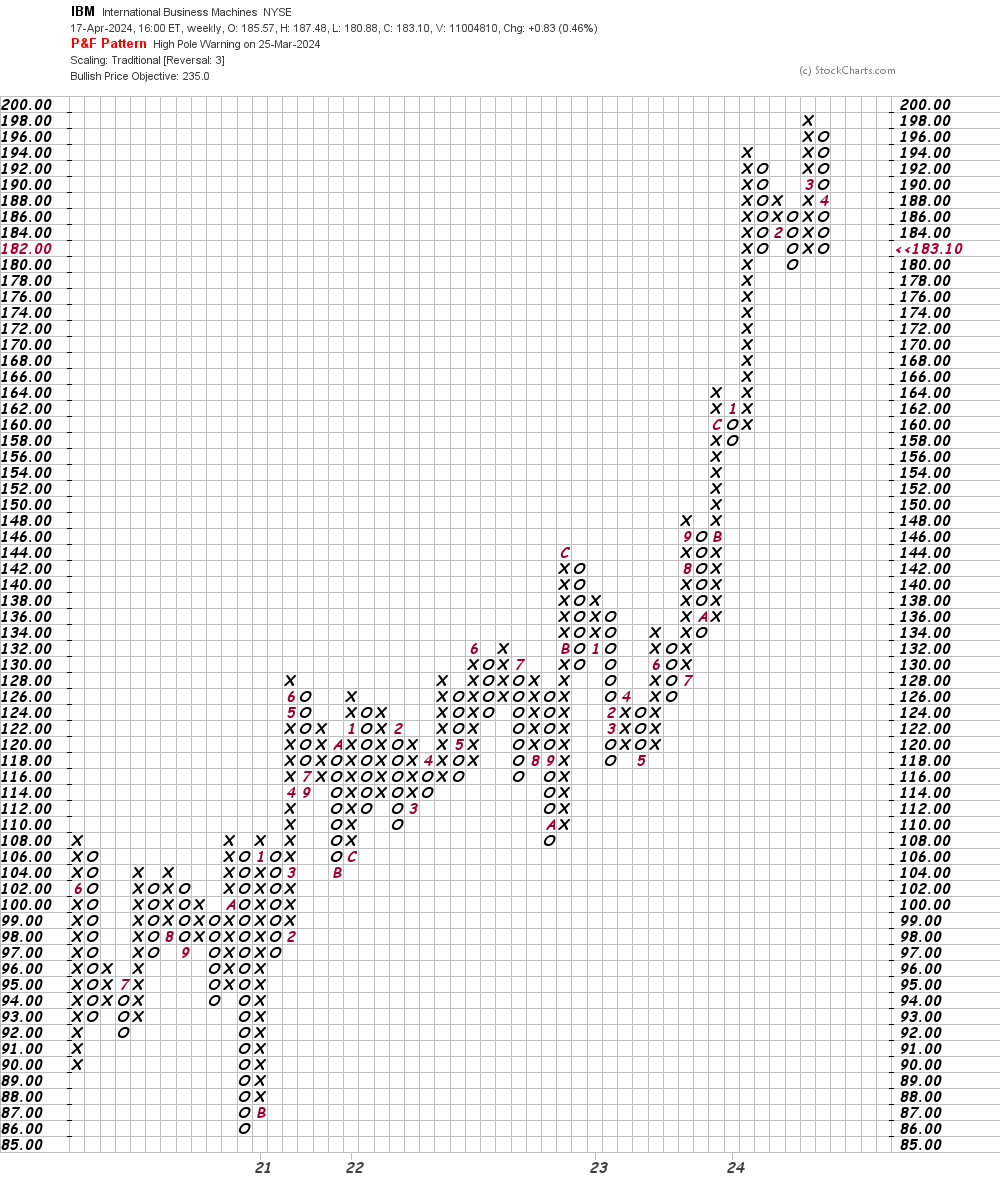
In this weekly Point and Figure chart of IBM, below, the software suggests an upside price target in the $235 area, but a trade at $178 could weaken this picture.
Bottom line strategy: I don't know what IBM will tell shareholders next week, but the charts have weakened and further declines look possible.
Employees of TheStreet are prohibited from trading individual securities.