How to Trade Best Buy After It Surges to the Upside
Let's check out the charts and indicators and update our strategy.
You've reached your free article limit
You've read 0 of 1 free Pro articles.
Thursday morning, retailer Best Buy BBY reported non-GAAP EPS of $1.34, which beat estimates by $0.18, and revenue of $9.29 billion, which beat by $40 million. Let's check out the charts and indicators for a trading strategy.
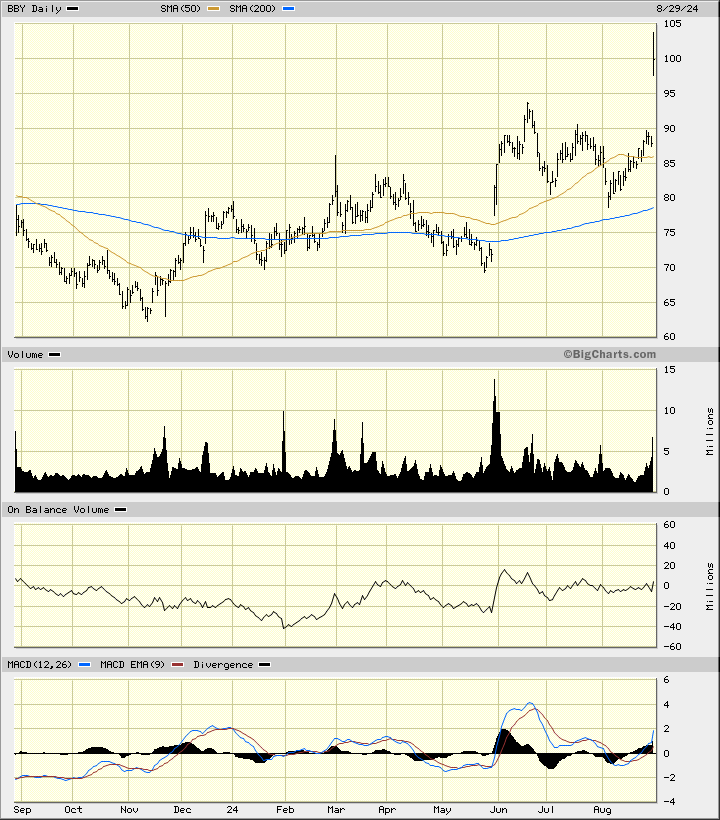
In the daily bar chart of BBY, below, I can see that the shares gapped sharply higher today. BBY is trading closer to the highs of the day and trading volume is heavier than normal — both a strong signal. BBY trades above the flat 50-day moving average line and above the rising 200-day line.
The daily On-Balance-Volume (OBV) line shows a rise from February but a neutral trend the past three months. The Moving Average Convergence Divergence (MACD) oscillator just turned up above the zero line.
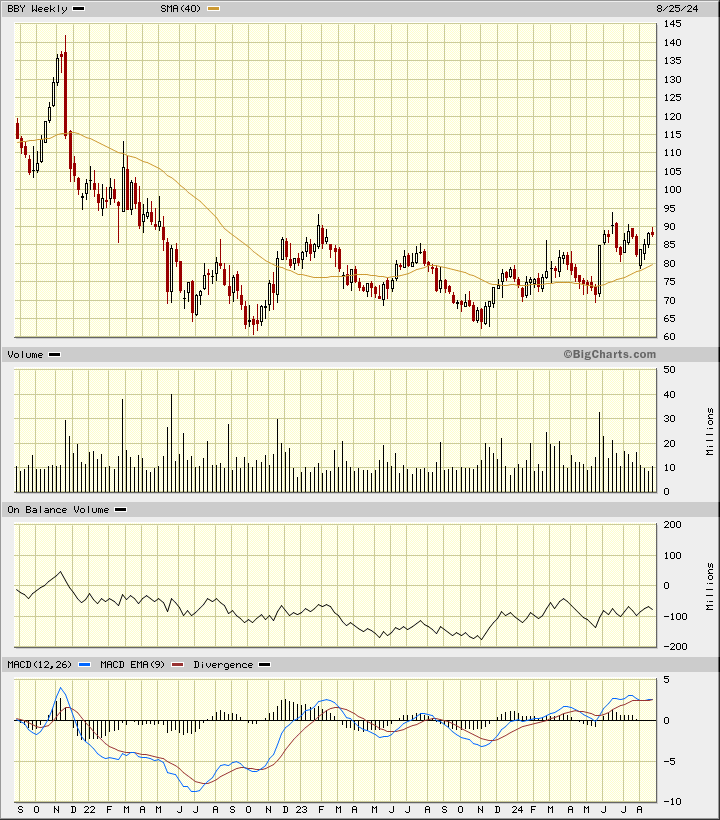
In the weekly Japanese candlestick chart of BBY, below, I see a strong base pattern and I have to imagine today's rally to a new high for the move up. Prices are trading above the rising 40-week moving average line.
The weekly OBV line is up from its November low. The MACD oscillator is in a positive alignment above the zero line.
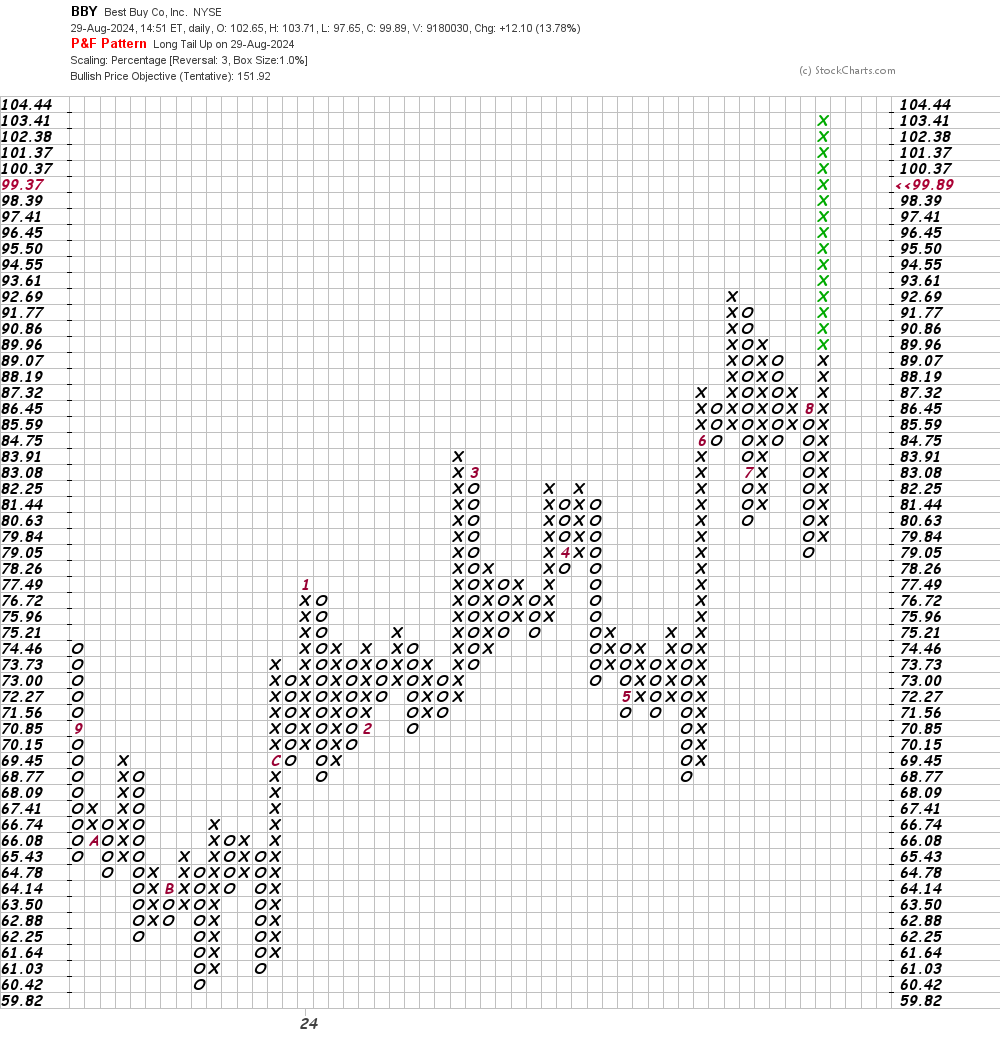
In this daily Point and Figure chart of BBY, below, I can see the rally in BBY today with no price gap. The software is suggesting an upside price target in the $152 area.
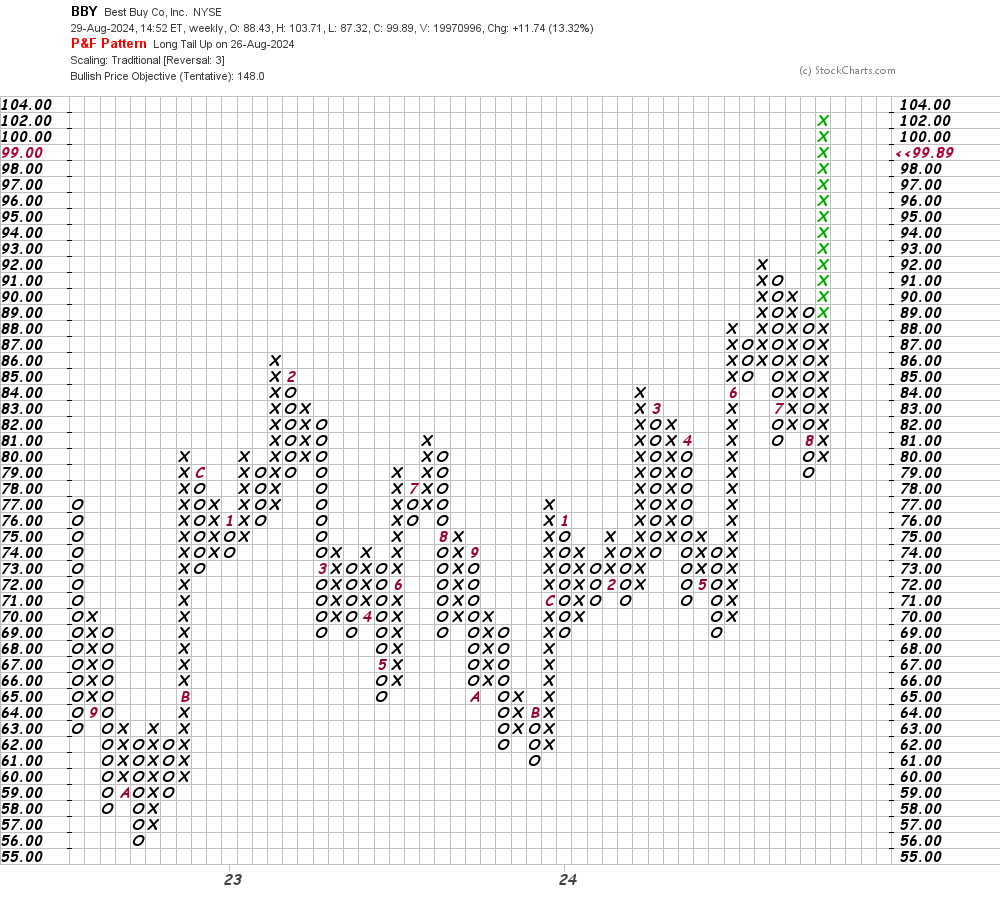
In this weekly Point and Figure chart of BBY, below, I can see a price target in the $148 area.
Bottom-line strategy: In my May 30 review of BBY I recommended that "A pullback to fill today's gap is possible so traders need not go long at the market. Be a patient buyer. Risk to $68." If you used the dips in BBY in early July and early August to buy then you have done well. Raise stops to at least $80.
Employees of TheStreet are prohibited from trading individual securities.