Best Buy Gaps Higher But the Picture Is Mixed
Let's check the charts and see how to play the stock now.
You've reached your free article limit
You've read 0 of 1 free Pro articles.
Thursday morning Best Buy BBY reported a Non-GAAP EPS of $1.20 which beat by $0.13 and revenue of $8.85B that missed by $120M. The company noted improved profitability despite seeing sales fall in Q1.
Speaking of sales, we just bought two TVs during the company's Memorial Day sale. The pictures are sharp and clear so let's check and see if the charts and indicators are the same way.
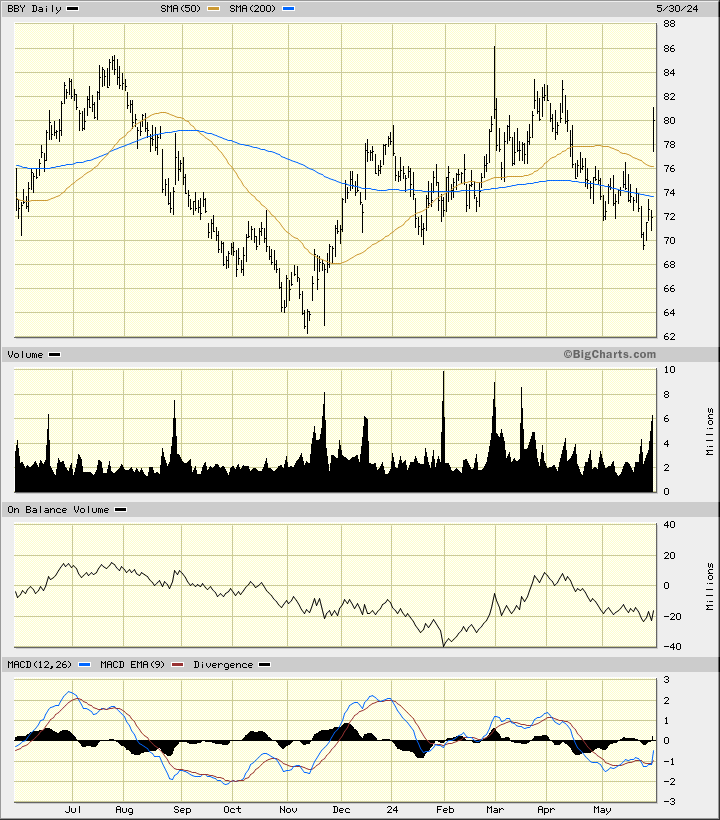
In this daily bar chart of BBY, below, I can see that prices have moved sideways the past six months. Prices gapped above the 50-day moving average line and above the slower-to-react 200-day moving average line.
The On-Balance-Volume (OBV) line was trending lower the past two months so traders were not acting as aggressive buyers ahead of today's report. The trading volume does show an increase in the days leading up to today and that suggests either short covering or fresh buying.
The Moving Average Convergence Divergence (MACD) is below the zero line but it has started to turn higher.
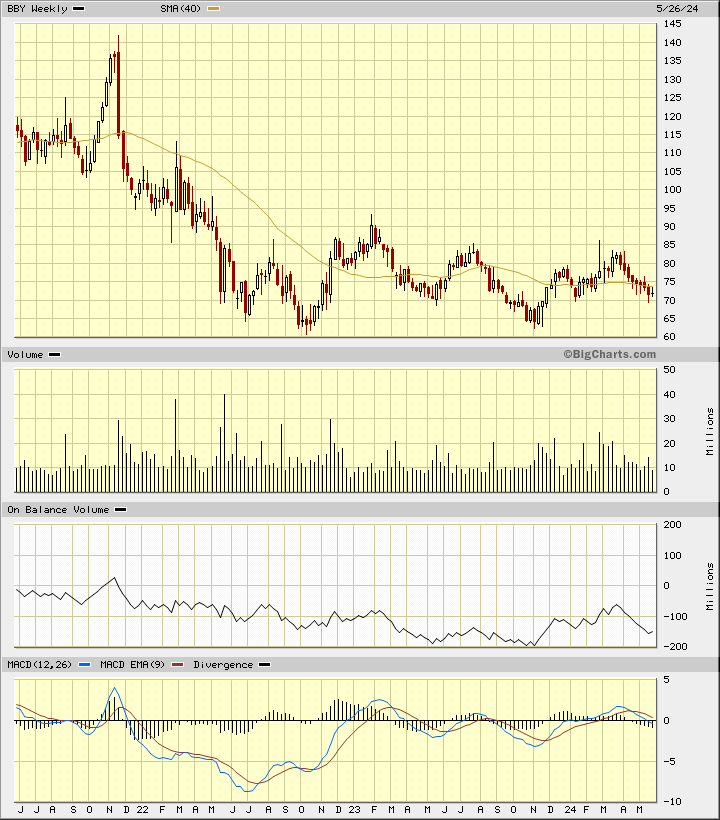
In this weekly Japanese candlestick chart of BBY, below, I can see that prices have been bottoming the past two years. BBY trades above the 40-week moving average line but its slope has not yet turned positive.
The weekly OBV line and the MACD oscillator were both weak ahead of today's news.
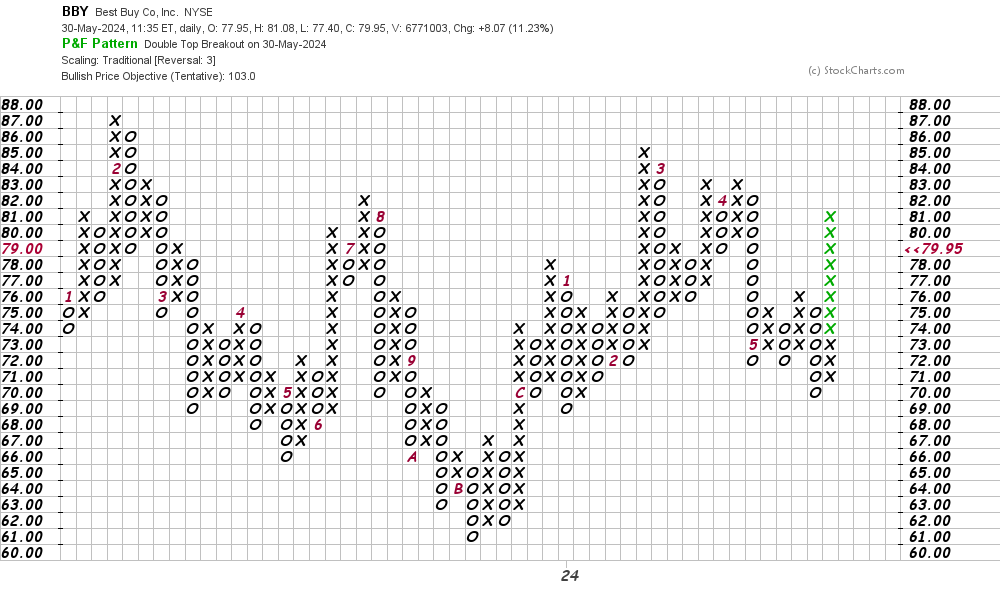
In this daily Point and Figure chart of BBY, below, I can see today's rally with no gap and I can see a price target in the $103 area.
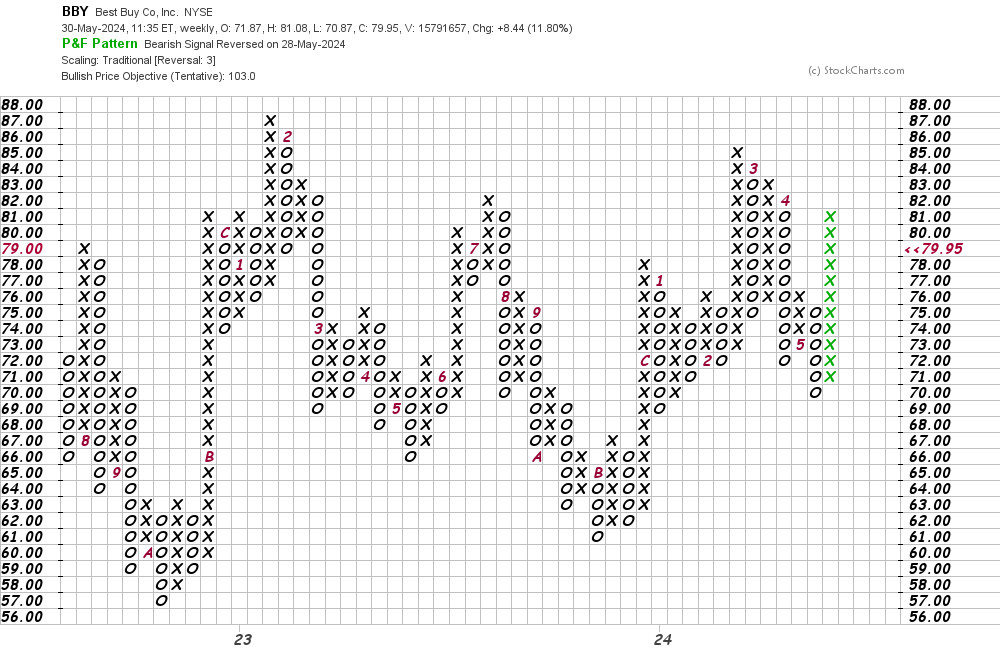
In this weekly Point and Figure chart of BBY, below, I can see the $103 price target again.
Bottom line strategy: If the daily and weekly OBV lines on BBY were climbing I would be more aggressive on my view of BBY. A pullback to fill today's gap is possible so traders need not go long at the market. Be a patient buyer. Risk to $68.
Employees of TheStreet are prohibited from trading individual securities.