Higher Prices for DraftKings Look Like a Long Shot
The daily fantasy and sportsbook name has been struggling in the doldrums of the sports calendar.
You've reached your free article limit
You've read 0 of 1 free Pro articles.
The NBA and NHL playoffs are over and the start of the football season is months away. Amid that, the stock charts for DraftKings DKNG are looking more and more like a long shot.
Let's check out the charts and indicators.
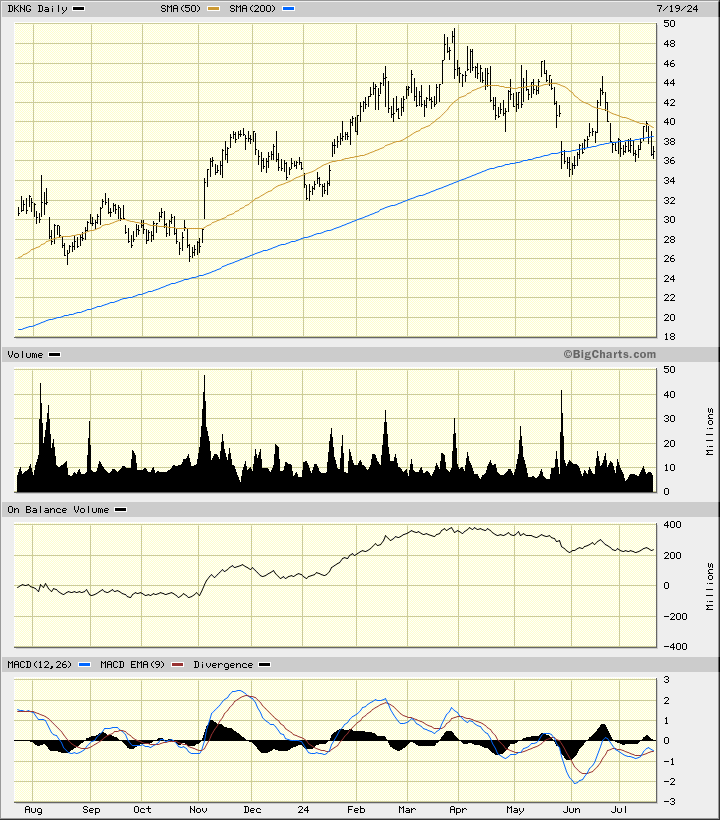
In this daily bar chart of DKNG below, I can see prices reached a zenith in late March. Prices have declined for the past four months and now trade below the declining 50-day moving average line and below the cresting 200-day moving average line. The daily On-Balance-Volume (OBV) line has weakened since early April and it tells me that sellers of DKNG are being more aggressive than buyers. The trend-following Moving Average Convergence Divergence (MACD) oscillator is below the zero line and tells me that the trend is weak.
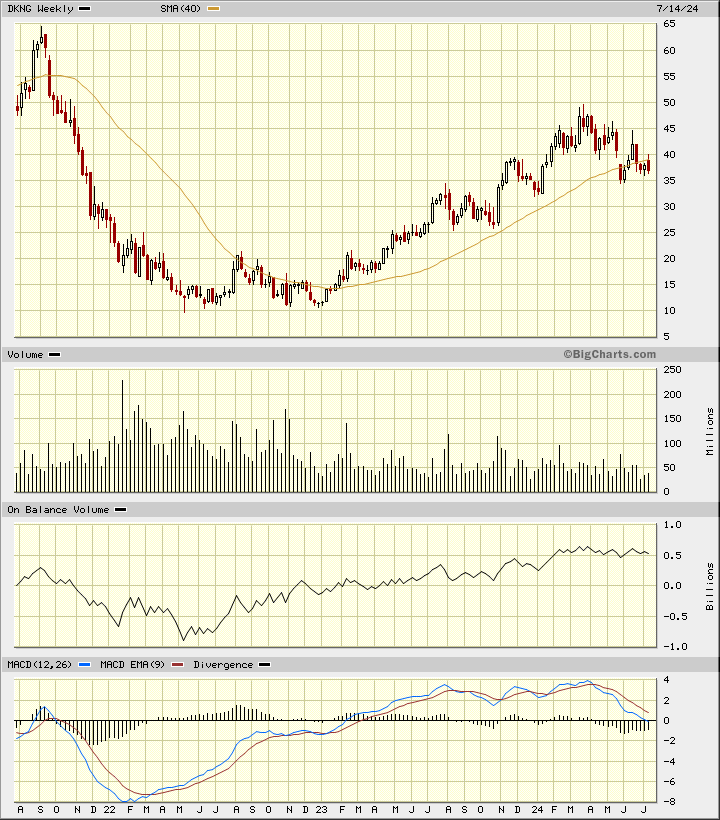
In this weekly Japanese candlestick chart of DKNG below, I see a picture that suggests we will see weaker prices in the days ahead. Prices are trading below the cresting 40-week moving average line. The weekly volume histogram shows shrinking volume for several months telling us that investors interest has weakened. The weekly OBV line has turned lower since March. The MACD oscillator has weakened and now is only slightly above the zero line.
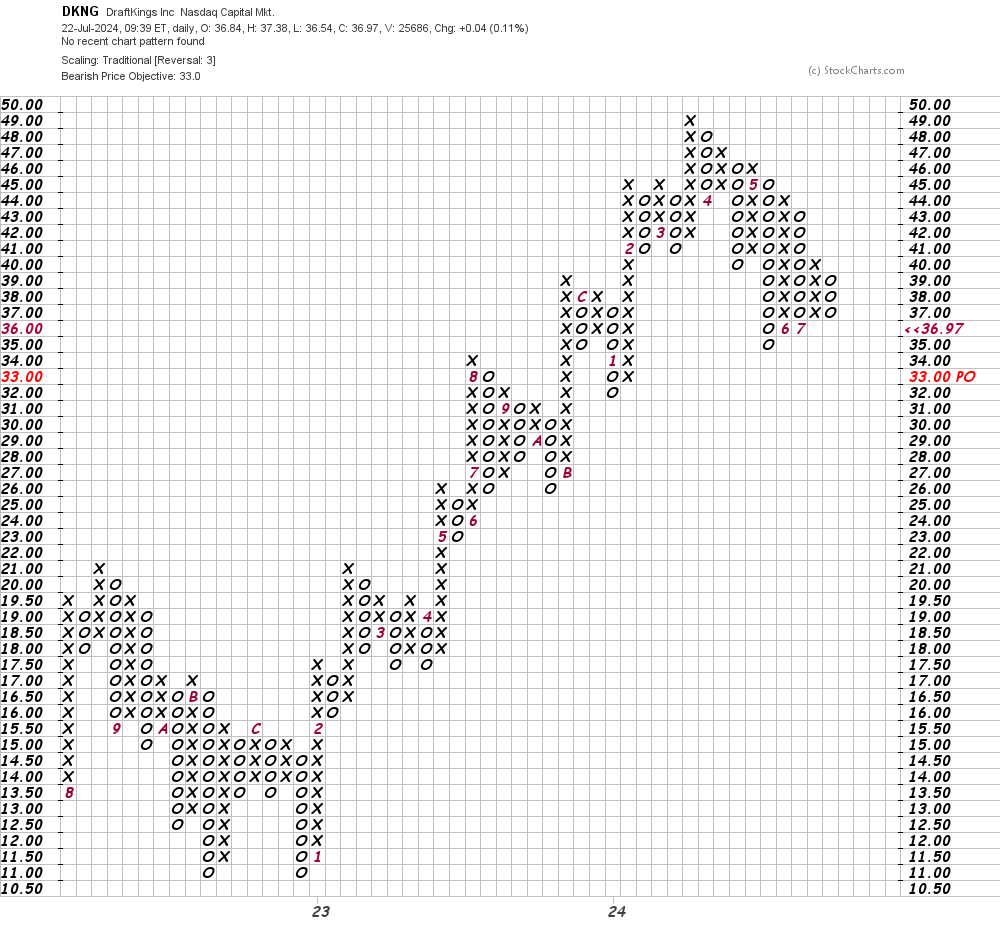
In this daily Point and Figure chart of DKNG below, I can see a downside price target in the $33 area.
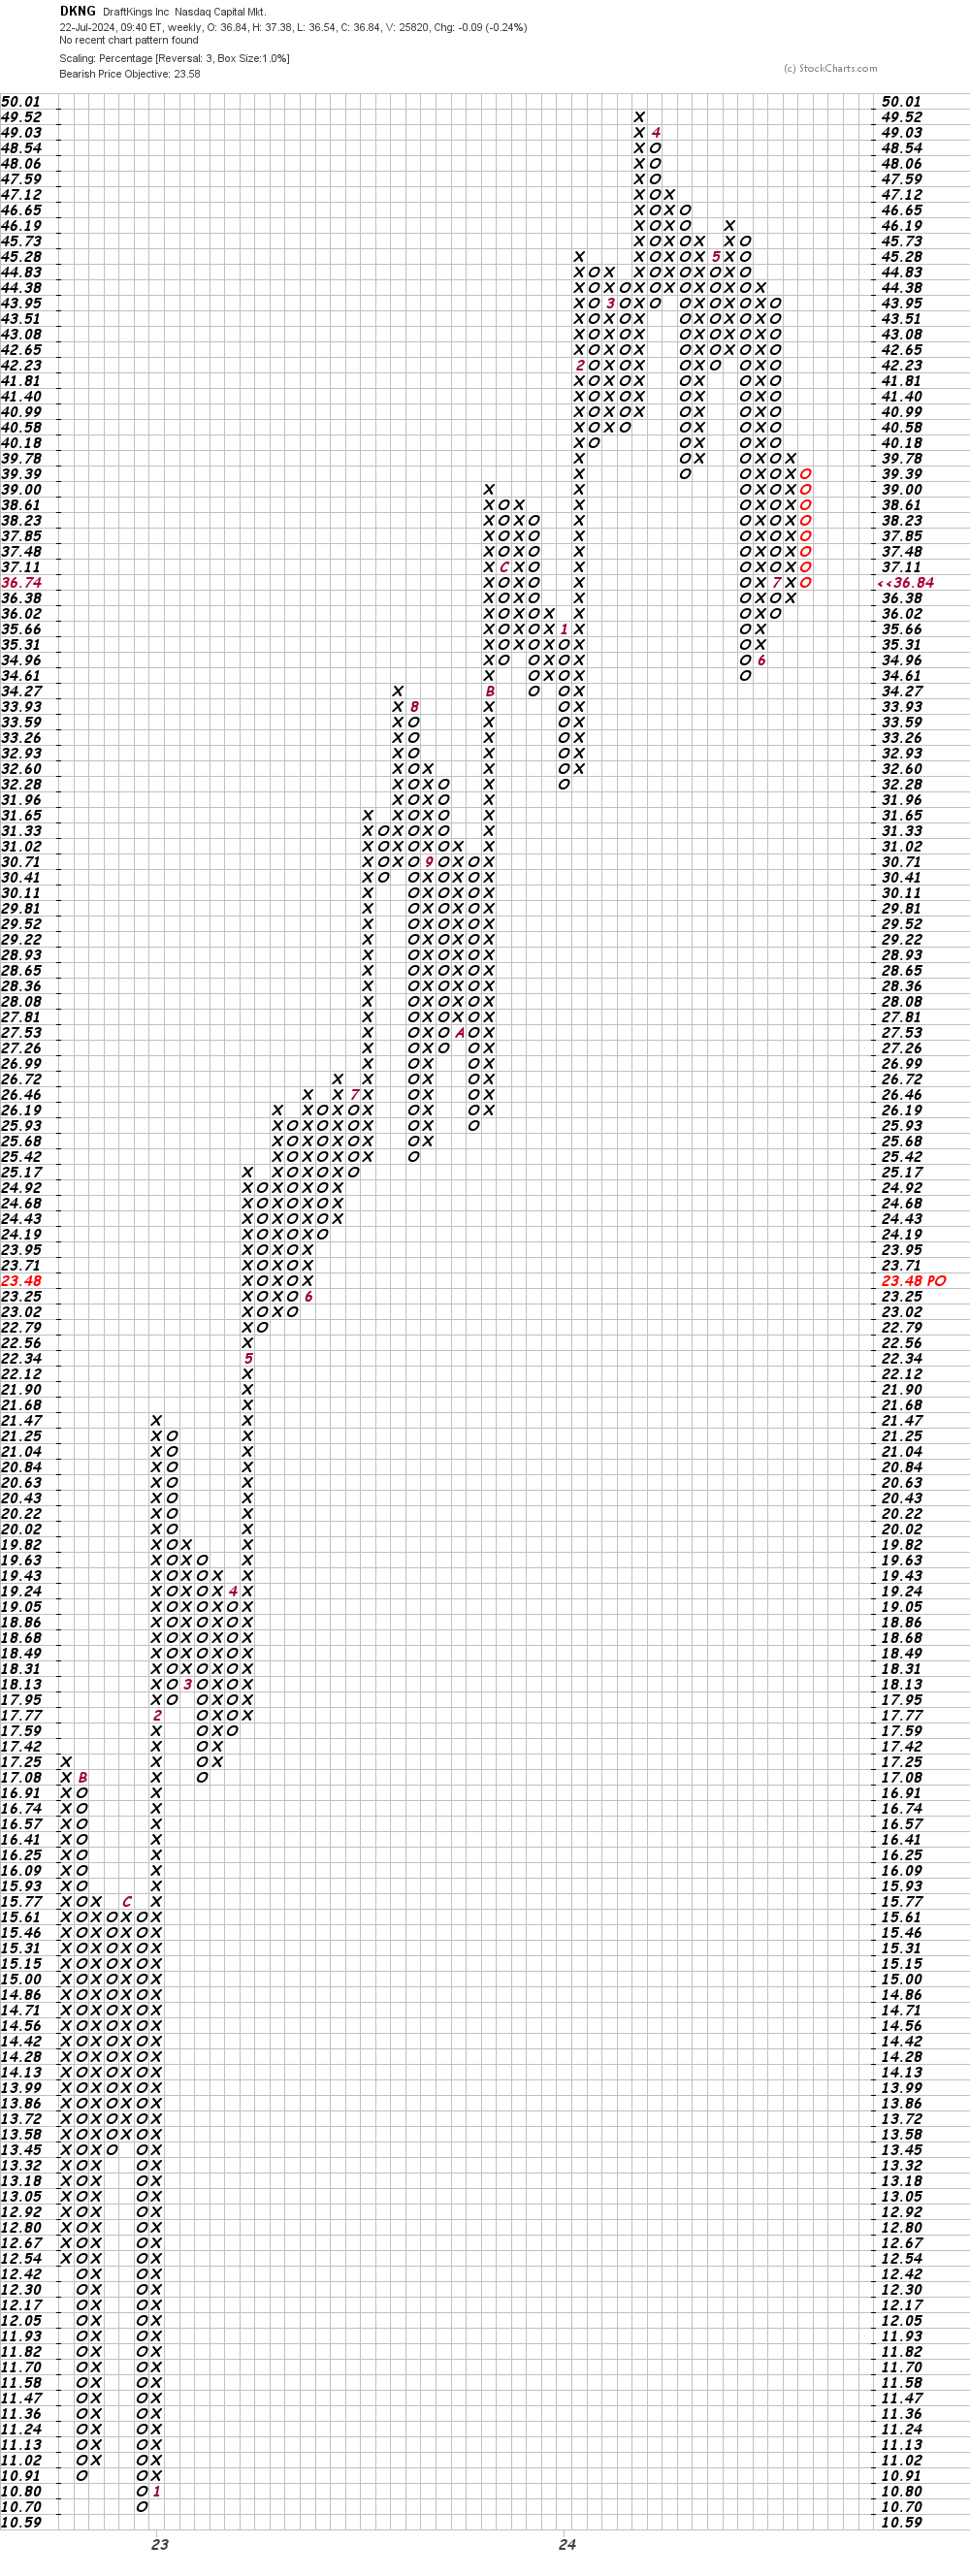
In this weekly Point and Figure chart of DKNG below, I can see a price target in the $24 area.
Bottom line strategy: Investment analysts at major Wall Street firms do not use the word "bet" in their reports and neither do I. The charts and indicators of DKNG suggest we could see lower prices for the shares of this wagering firm in the weeks ahead.
Employees of TheStreet are prohibited from trading individual securities.