Here's Why Tesla Can't Catch a Break
There's nothing bullish about it as these charts show.
You've reached your free article limit
You've read 0 of 1 free Pro articles.
Shares of Tesla TSLA are under selling pressure Thursday after Deutsche Bank DB downgraded the EV maker due to its Model 2 production delay to 2025.
There are also reports that Musk is shifting his attention to a new robotaxi platform. And let's not forget about the attention he gets for his pay package.
Let's check out the charts.
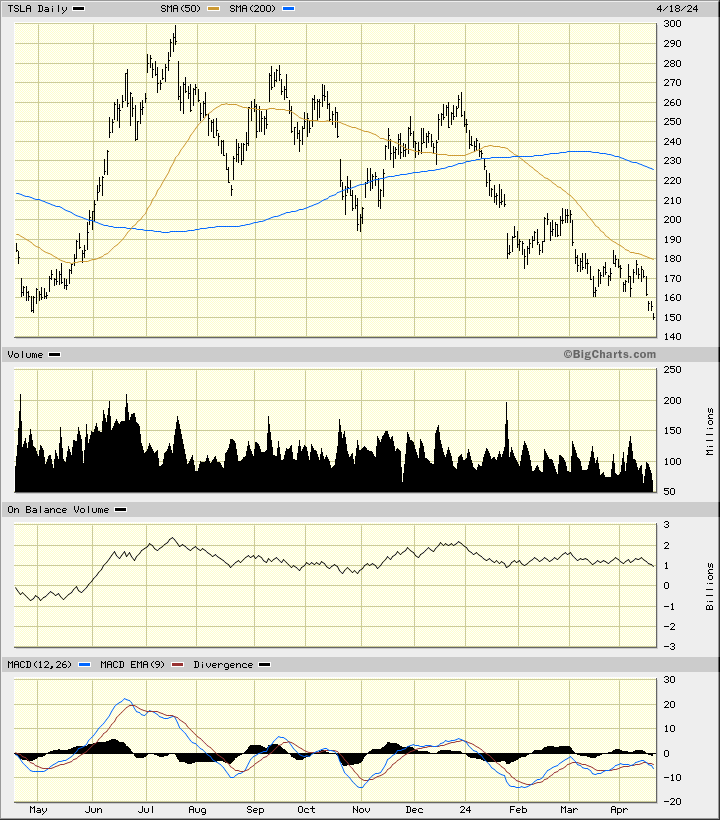
In this daily bar chart of TSLA, below, I can see that prices have continued their downtrend. TSLA continues to trade below the declining 50-day moving average line and below the bearish 200-day line. Bounces towards the underside of the 50-day line in the past three months have been sold. Trading volume has declined in the past three months suggesting that prices are falling of their own weight.
The On-Balance-Volume (OBV) line has quietly slipped lower since late December telling me that sellers of TSLA are more aggressive than buyers -- heavier volume is being recorded on days when TSLA has closed lower.
The Moving Average Convergence Divergence (MACD) oscillator has spent most of the year below the zero line where it is now.
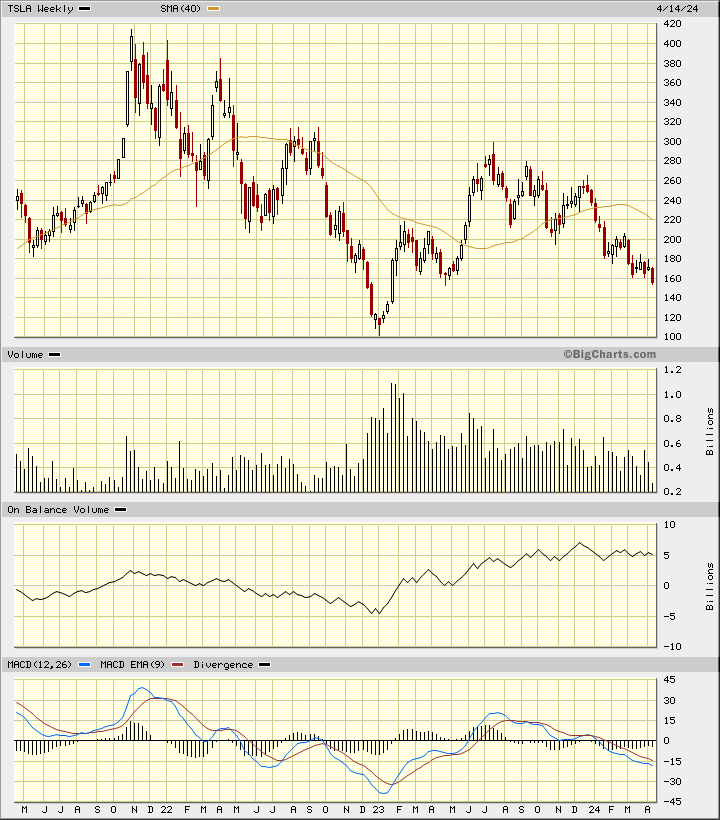
In this weekly Japanese candlestick chart of TSLA, below, I can see that prices have spent much of the last three years in a downward channel. Prices trade below the declining 40-week moving average line.
Trading volume has been shrinking and the weekly OBV line has been weak since December. The MACD oscillator is in a bearish alignment below the zero line.
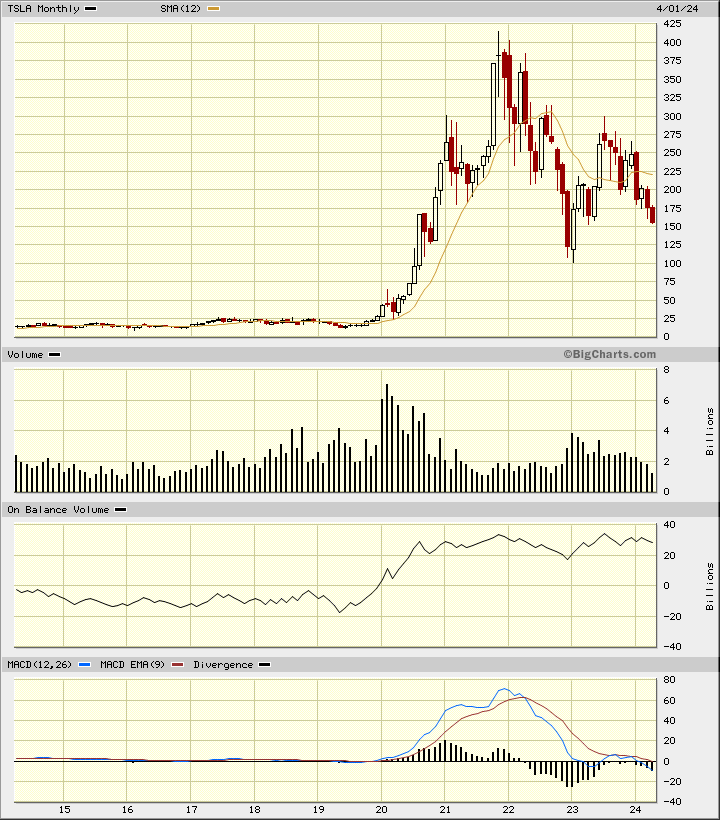
In this monthly Japanese candlestick chart of TSLA, I can see a major top reversal pattern. A breakdown from this long-term top pattern could mean a return to the levels seen before 2020. Ouch.
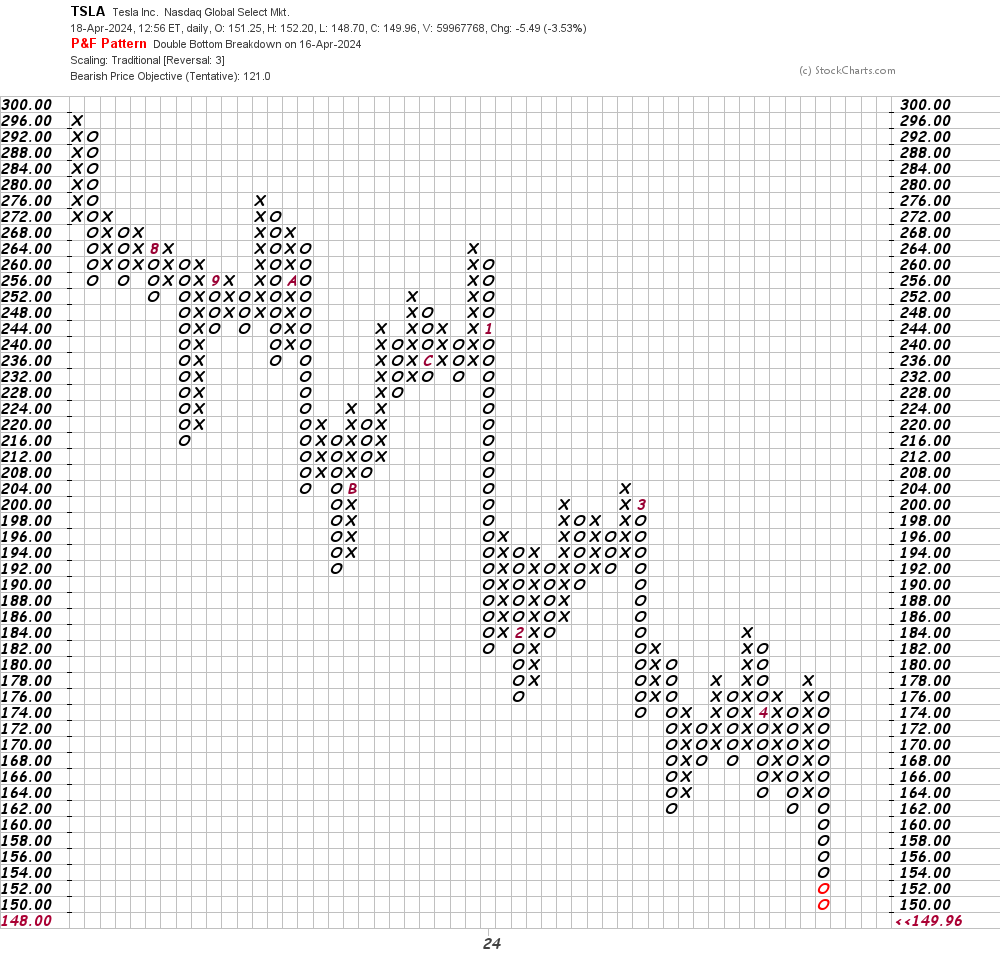
In this daily Point and Figure chart of TSLA, below, I can see that the software is projecting a potential downside price target in the $122 area.
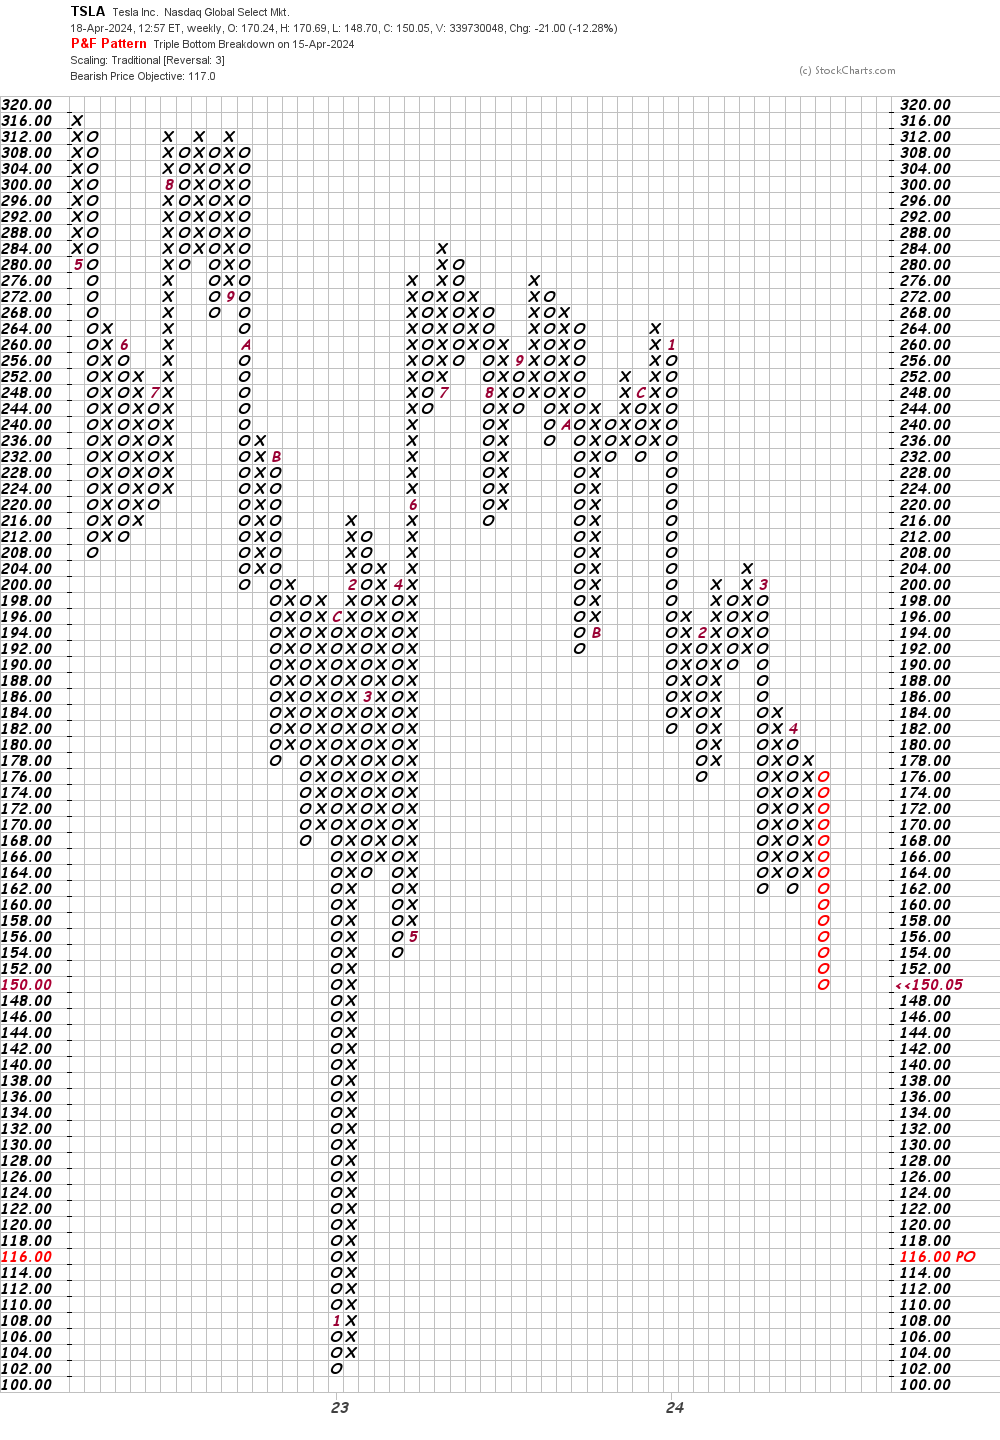
In this weekly Point and Figure chart of TSLA, below, I can see a downside price target in the $117 area.
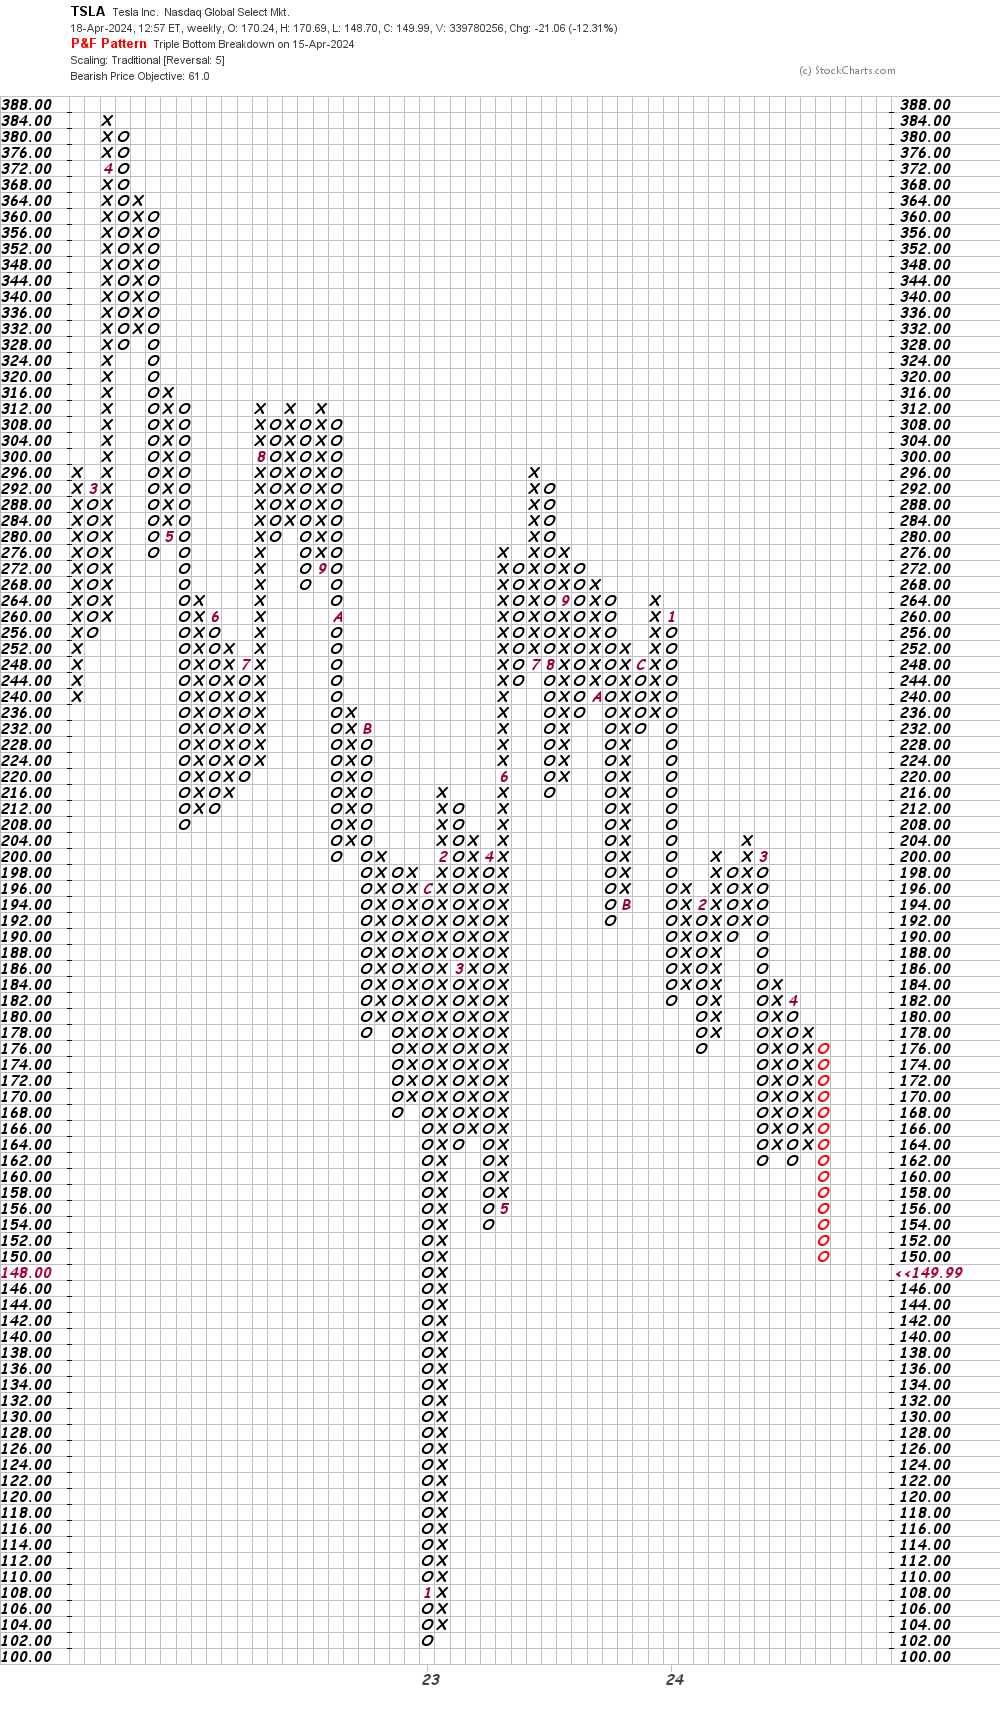
In this second weekly Point and Figure chart of TSLA, below, I used a five box reversal filter. Here the X's and O's give us a price target in the $61 area.
Bottom line strategy: I have been writing about TSLA for several years now. Some stories have been bullish and some bearish. Years ago when I authored a bearish story on TSLA I would get emails from TheStreet Pro subscribers that they loved their Tesla and Musk was a genius.
Today I don't get push back on bearish stories.
Employees of TheStreet are prohibited from trading individual securities.