Here's Why I Don't Trust Alphabet's Recent Strength
This is the fastest-turning technical sell signal I know.
You've reached your free article limit
You've read 0 of 1 free Pro articles.
Shares of Alphabet (GOOGL) just posted a new 52-week high. Shouldn't we buy new highs? Many times the answer is yes but sometimes the answer could be no.
Let's check out the charts and indicators.
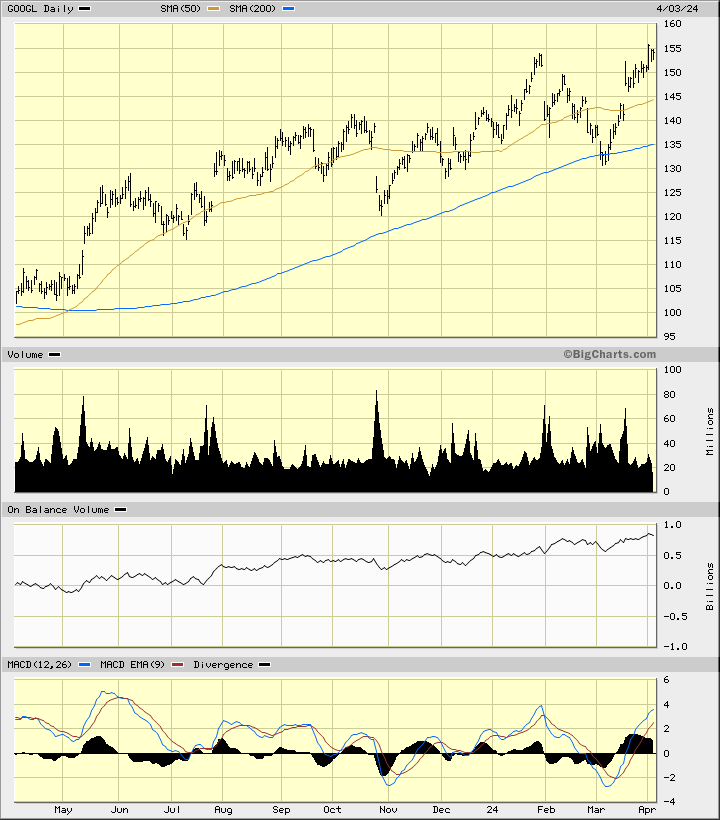
In the daily bar chart of GOOGL, below, I can see that share prices have traded higher the past 12 months. The stock has moved higher the past year and oscillated around the rising 50-day moving average line. I can see just three tests of the rising 200-day moving average line — last April, late October and again in early March.
The trading volume has been active the past year but I cannot declare that volume has expanded in the direction of the trend. The daily On-Balance-Volume (OBV) line shows a stepwise advance. The trend-following Moving Average Convergence Divergence (MACD) oscillator is above the zero line but likely to make a high equal to late January high for this indicator.
In the daily Japanese candlestick chart of GOOGL, below, I am looking at just the past six months. The two most recent candles are spinning tops with small real bodies. On a bar chart we would call this two inside days but the candles suggest a balance between bulls and bears. This balance could be easily upset with a bearish or red candle in the near future.
The 12-day momentum study has been weakening since the middle of March. Momentum is a leading indicator. Just saying.
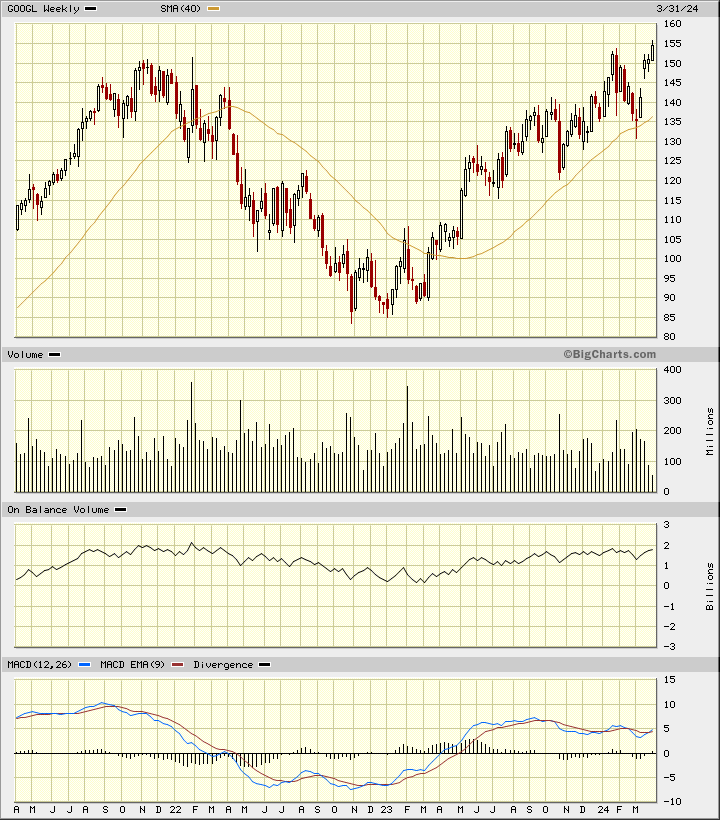
In the weekly Japanese candlestick chart of GOOGL, below, I can see that share prices have moved up in a channel since late 2022. I have not drawn in the uptrend line and the parallel return line but you can do that from the comfort of your home or office. With upward-sloping channels I pay attention to when prices do not reach the return line. This is a sign that momentum has peaked and traders are selling before the upper end of the channel is reached.
The weekly OBV line is stalled and the MACD oscillator has been correcting for months now.
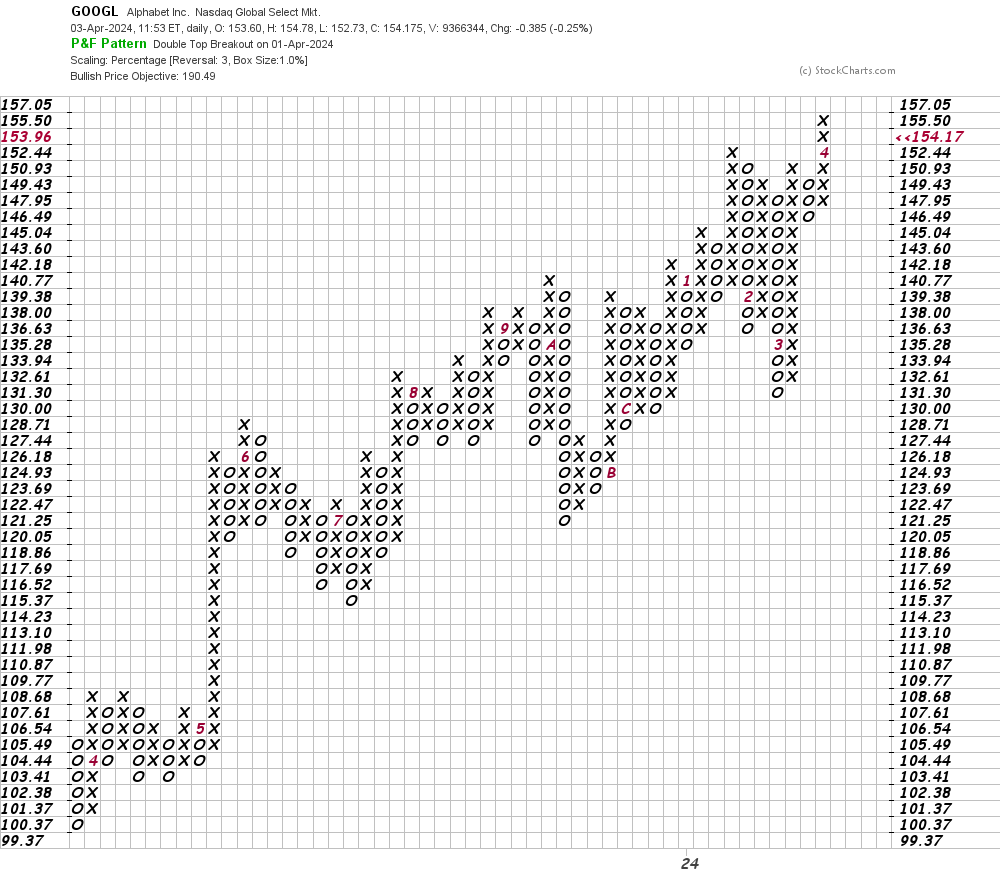
In this daily Point and Figure chart of GOOGL, below, I can see a price target in the $190 area. A trade at $150 could start to weaken this chart.
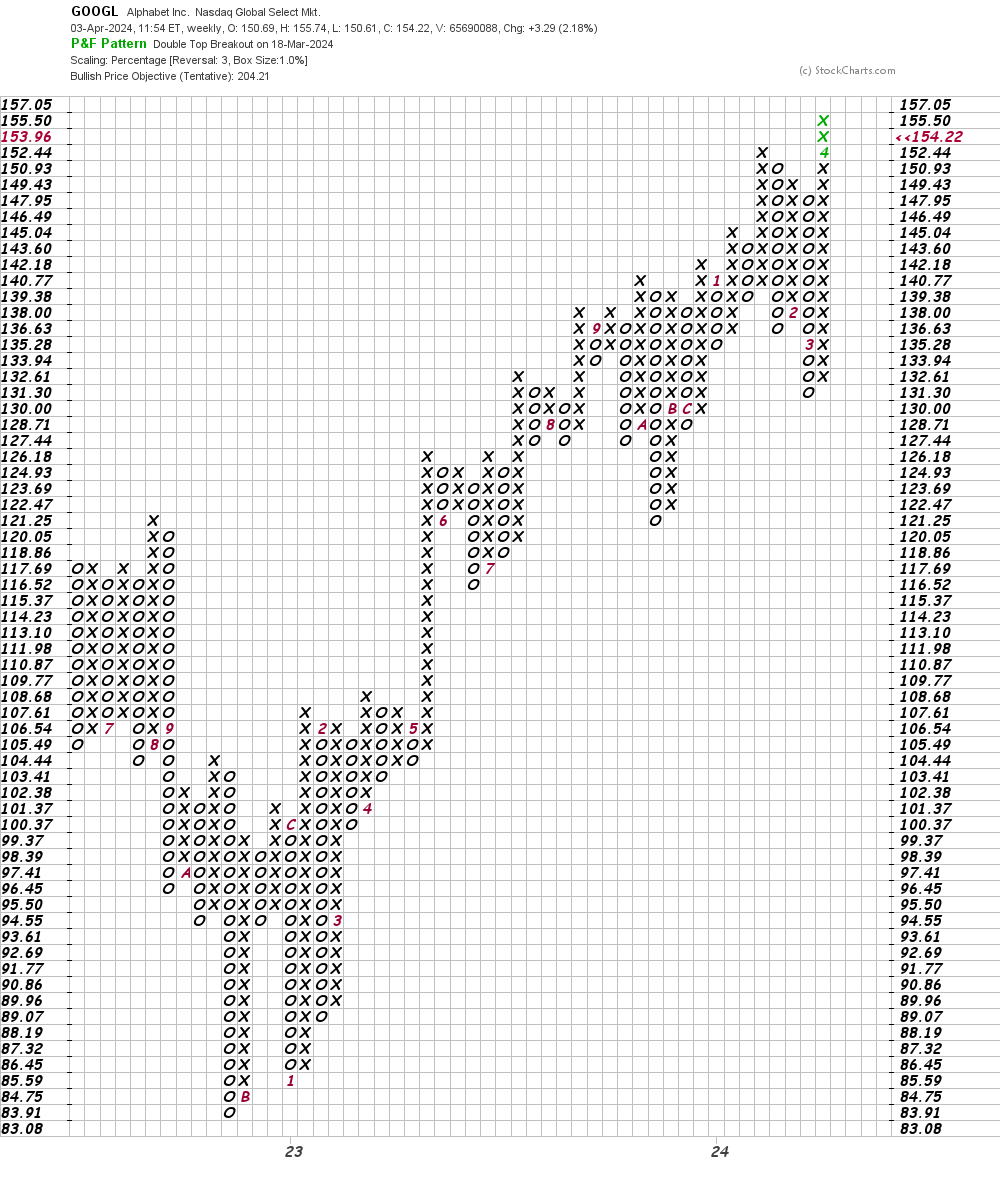
In this weekly Point and Figure chart of GOOGL, below, a price target of $204 being shown.
Bottom-line strategy: A "trade below the low of the high day" is the fastest-turning technical sell signal I know. GOOGL made a new high on Monday. A close below $150 could be the start of a downside move in GOOGL.
Employees of TheStreet are prohibited from trading individual securities.