Growing Old Is Not Great for Everyone, Except Maybe Labcorp
Traders should consider making their own appointment.
You've reached your free article limit
You've read 0 of 1 free Pro articles.
I got a reminder the other day about an upcoming doctor's appointment and needed to make an appointment for some blood tests. There is a Labcorp LH office about one mile from my house so I went online to make an appointment. Scheduling was easy but I noticed that I could not get an early appointment right away. The early appointments were booked up for about two weeks.
I guess you can view this in at least two ways. One way is that there are a lot of people in southern Delaware needing lab services. Another way of looking at is that LH is doing something right and it has attracted more customers.
Let's check the charts and indicators of LH to see if this increased demand is translating into higher stock prices. Labcorp is a holding in TheStreet Pro Portfolio.
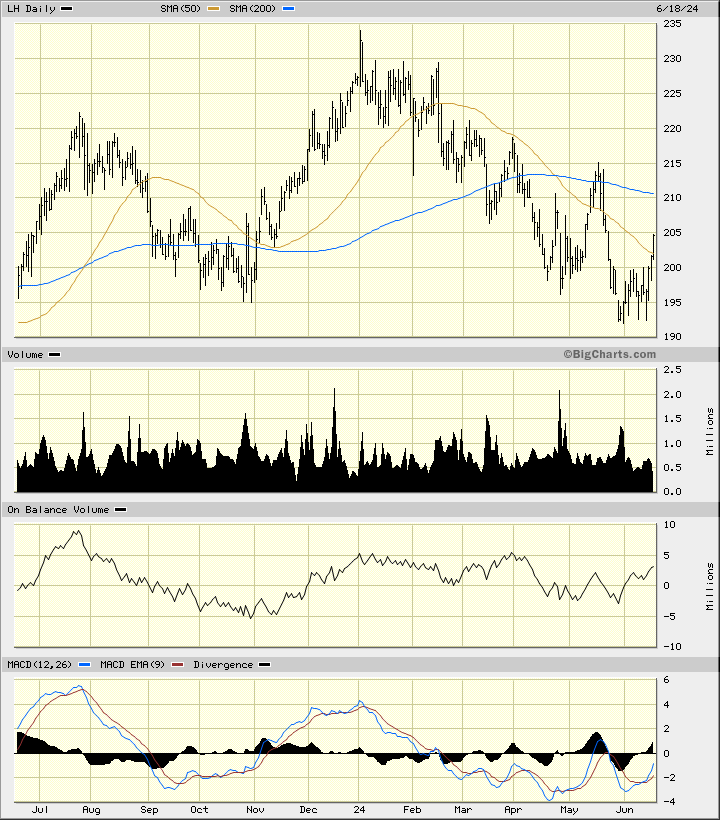
In this daily bar chart of LH, below, I can see that the shares have traded lower the past six months. Prices show some bottoming price action in June with dips to and under $195 being bought.
The daily On-Balance-Volume (OBV) line turns higher in June signaling a shift from aggressive selling to aggressive buying. The Moving Average Convergence Divergence (MACD) oscillator is crossing to the upside from below the zero line for a cover shorts buy signal. The MACD oscillator is also making a higher low when prices made a lower low. This is a bullish divergence.
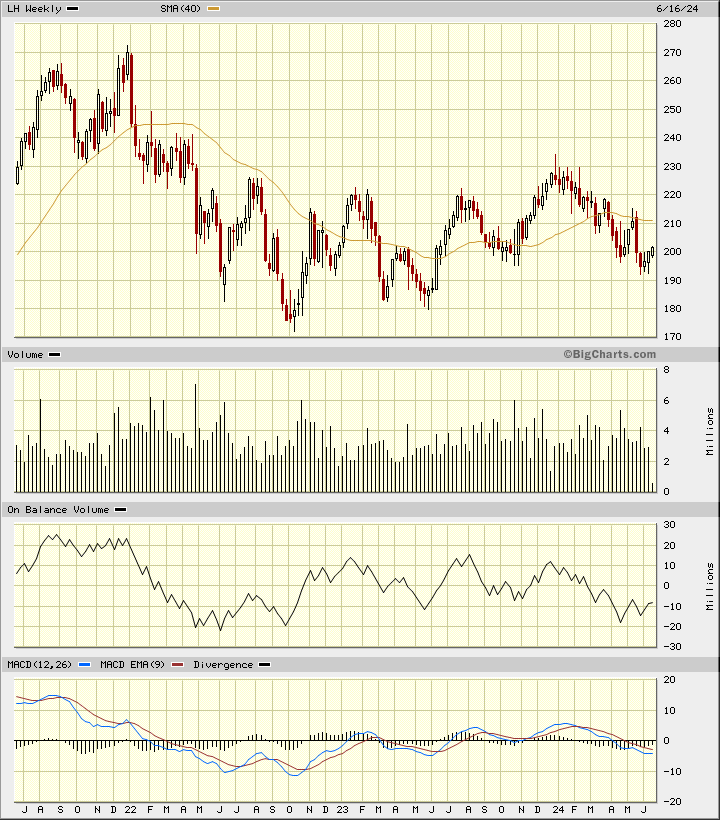
In the weekly Japanese candlestick chart of LH, below, I can see that prices have been bottoming the past two years. LH trades below the declining 40-week moving average line.
The weekly OBV line shows a small higher low from April to June. The MACD oscillator is below the zero line but narrowing toward a potential bullish crossover. Lower shadows on some of the candles in late May and June are encouraging.
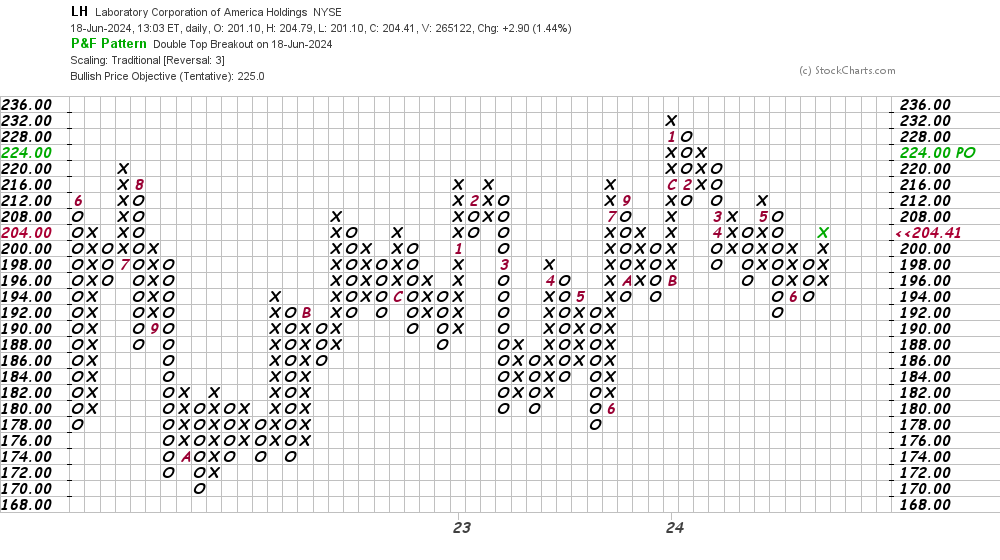
In this daily Point and Figure chart of LH, below, I can see an upside price target in the $225 area.
In this weekly Point and Figure chart of LH, below, I can see a small double bottom at $193.55 and a price target at $224.
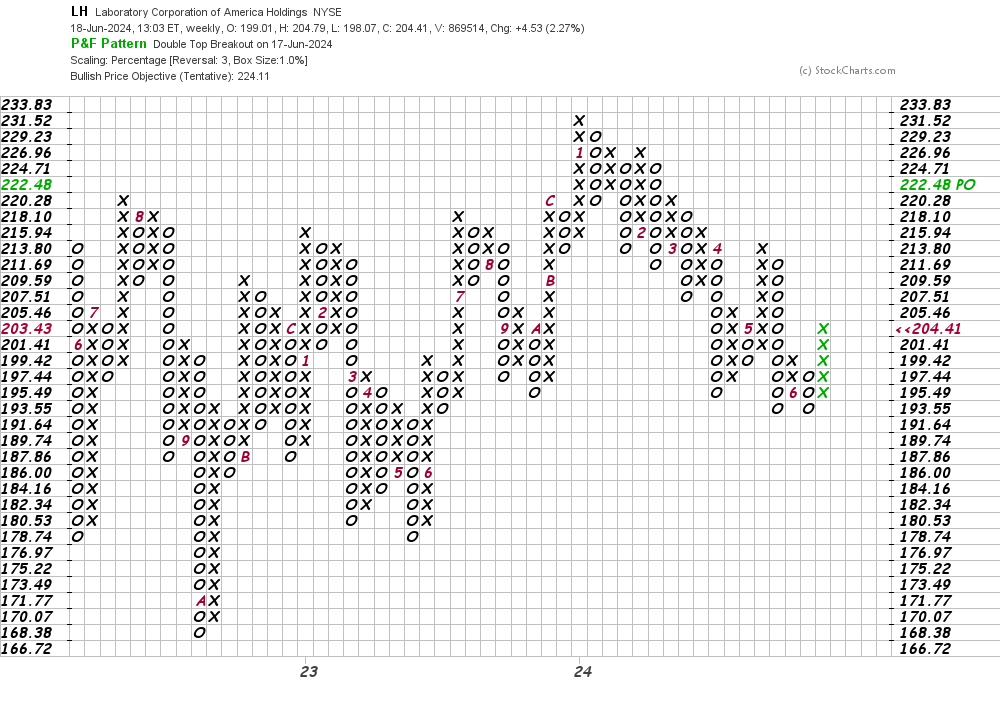
Bottom-line strategy: Traders could begin to probe the long side of LH on a shallow dip to $200 risking to $190. The $225 area is my first upside price target.
Employees of TheStreet are prohibited from trading individual securities.