Google Likes Intel. Nvidia Appears to as Well. And So Do I
Here’s how I’m going to handle this tech name as Alphabet and Nvidia reportedly eye INTC as backup to Taiwan Semiconductor.
You've reached your free article limit
You've read 0 of 1 free Pro articles.
Anyone else thinking about adding to, or initiating a new, long position in Intel (INTC)? The shares apexed at $132.75 almost a month ago (May 11) after a parabolic run in April. Since then, it’s been sort of a sideways-to-lower ride for shareholders. Will the share price come all the way back in? Gee whiz. I hope not. This was a $40 stock in late March. What caught my eye and made me take this serious look was the action over the past two days. On Friday, INTC gave up 11.3%, dragged lower by the entire semiconductor group after Broadcom (AVGO) reported.
On Monday, INTC rallied 11.2% on early reports that both Nvidia (NVDA) and Alphabet (GOOGL) were considering using Intel as a backup to Taiwan Semiconductor (TSM) to meet their respective foundry needs. Later in the day, The Information reported that due to capacity issues at TSM, that Google had indeed placed an order with Intel to manufacture more than three million tensor processing units in 2028. Google decided to tap Intel to manufacture these TPUs after months of testing Intel’s technology. Nvidia has apparently not yet placed an order with Intel and is still testing the technology.
The Chart Says…
… Game on. Yes, this is an opinion.
Take a look at the chart. Yes, I drew up the chart, so it reflects my interpretation of price discovery in this stock, but see if you see what I see. From last October into mid-April, INTC traded sideways in what I call a “flat base” or a (long) rectangle. This kind of pattern can signal an explosive breakout but is not directional. That breakout came in April and as we now know the direction was up. Big time. There was an unfilled gap left behind in late April that may have to be revisited at some point.
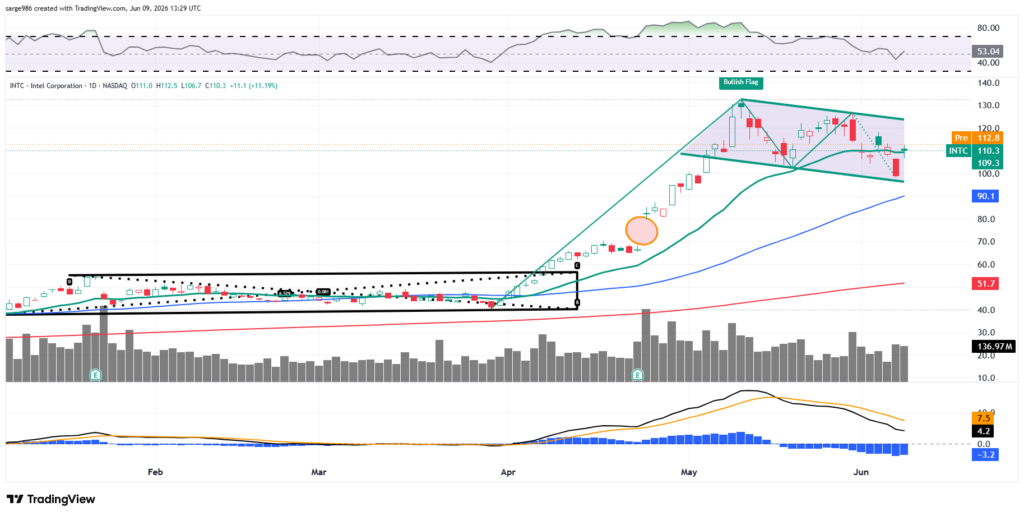
Readers will see that since peaking on May 11, INTC has traded lower, but gradually. I see that action expressed as a “bull flag.” A bull flag is considered to be a reliably accurate pattern that signals bullish trend continuance. This pattern represents a short-term pause or period of temporary consolidation after a sharp rise in price and before that price continues its upward momentum. I tend to use the closing price of the day of the recent high as my pivot for these patterns. That would be $129.
Looking at the indicators that I most often use, relative strength has regained the neutral line as the share price has regained its 21-day exponential moving average. That gets the swing crowd back on board. Below the chart, the daily moving average convergence divergence is not postured all that bullishly. However, as the histogram of the 9-day EMA has worked its way back up toward the zero-bound, the 12-day EMA appears to be working its way back up towards the 26-day EMA.
My Plan
I am very likely to reinitiate INTC at some point this week, perhaps later today in small size and wait for Wednesday’s consumer price index data to decide whether or not to grow the position.
Target Price: $155
Pivot: $129
Add: Down to 50-day SMA (currently $92)
Panic: Loss of 50-day SMA
At the time of publication, Guilfoyle was long NVDA, TSM equity.
