Gold Price Flashes Short-Term Warning to Investors as Turmoil Grows
International uncertainty in France and South Korea is driving traders to the U.S. dollar and commodities are reacting in kind.
You've reached your free article limit
You've read 0 of 1 free Pro articles.
Recently, our gold trade reached its conclusion. Shortly after the final target of $2,680 was hit, gold dropped sharply, and still hasn’t recovered.
When it will be time to get back into gold? I’m cautious right now, because the yellow metal could be forming a short-term bearish pattern.
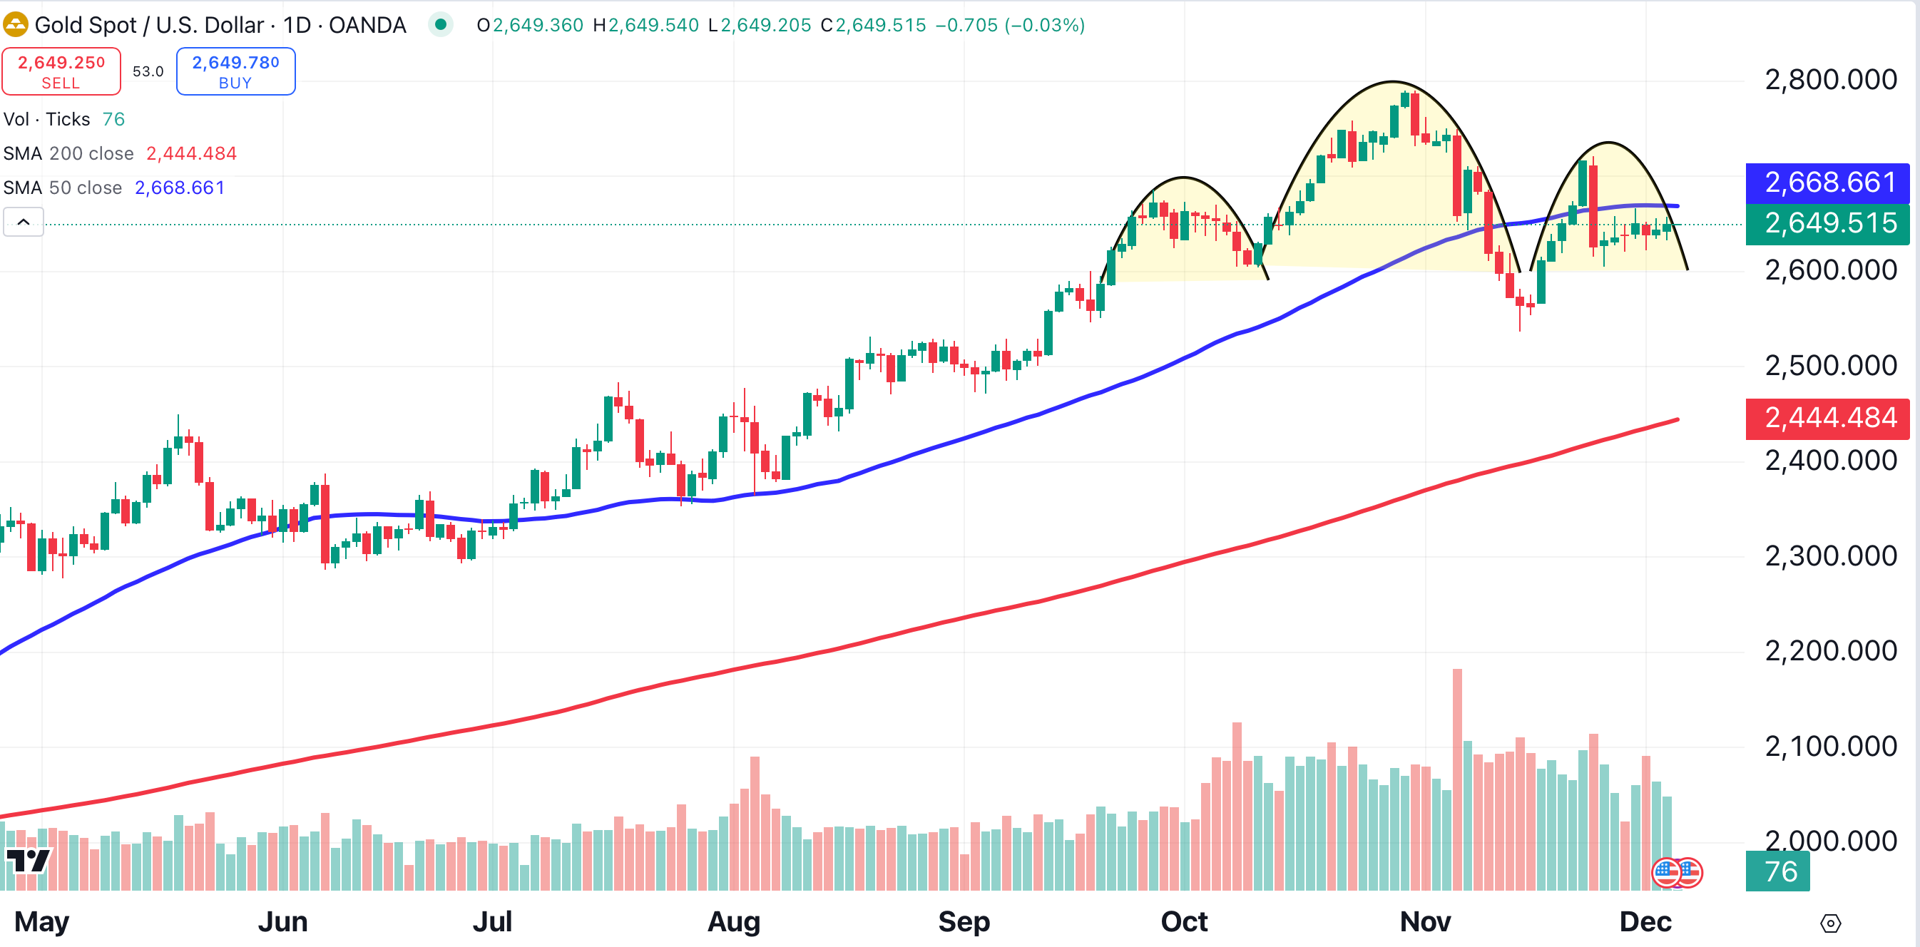
A potential head-and-shoulders pattern (shaded yellow) is forming on gold. This pattern is sloppy, and should be considered a short-term warning. It’s not necessarily a sell signal, because the pattern is incomplete.
I’m not turning bearish on gold by any means. This pattern may eventually dissolve into a consolidation. Gold has had an amazing run, so it shouldn’t come as a surprise if some profit taking occurs.
I’m even less sanguine about silver. We entered our most recent silver trade at an average price of $32.50. Since then, not much has happened. Silver continues to underperform gold, which has its own troubles, as noted above.
Like gold, silver appears to be forming a bearish head-and-shoulders pattern (shaded yellow).
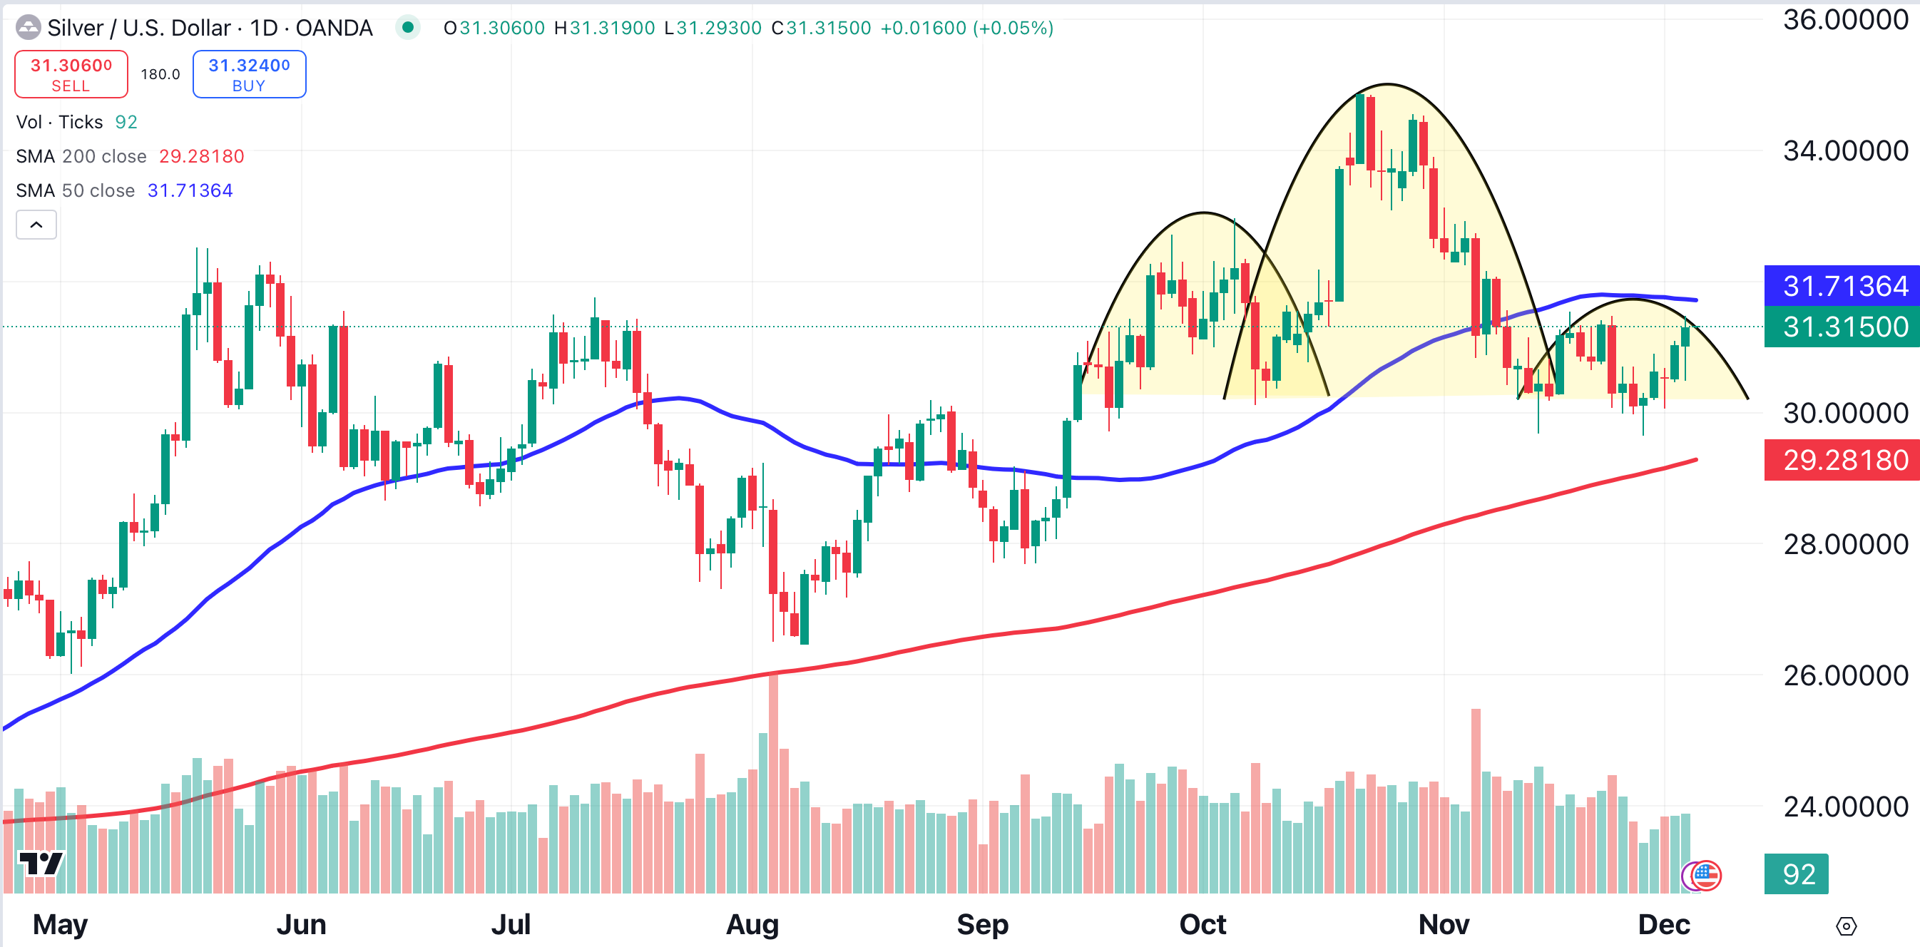
Spot silver traded down to $29.67 last week, narrowly missing our $29.50 stop. Since then, it has climbed as high as $31.48. I’m considering taking a small loss/breakeven on this trade, because it simply isn’t behaving the way I thought it would.
Crude oil has yet to hit my entry point of $72.50 (green), a level that hasn’t been reached since early November (red arrow). West Texas Intermediate continues to trade within a large descending triangle (black dotted lines).
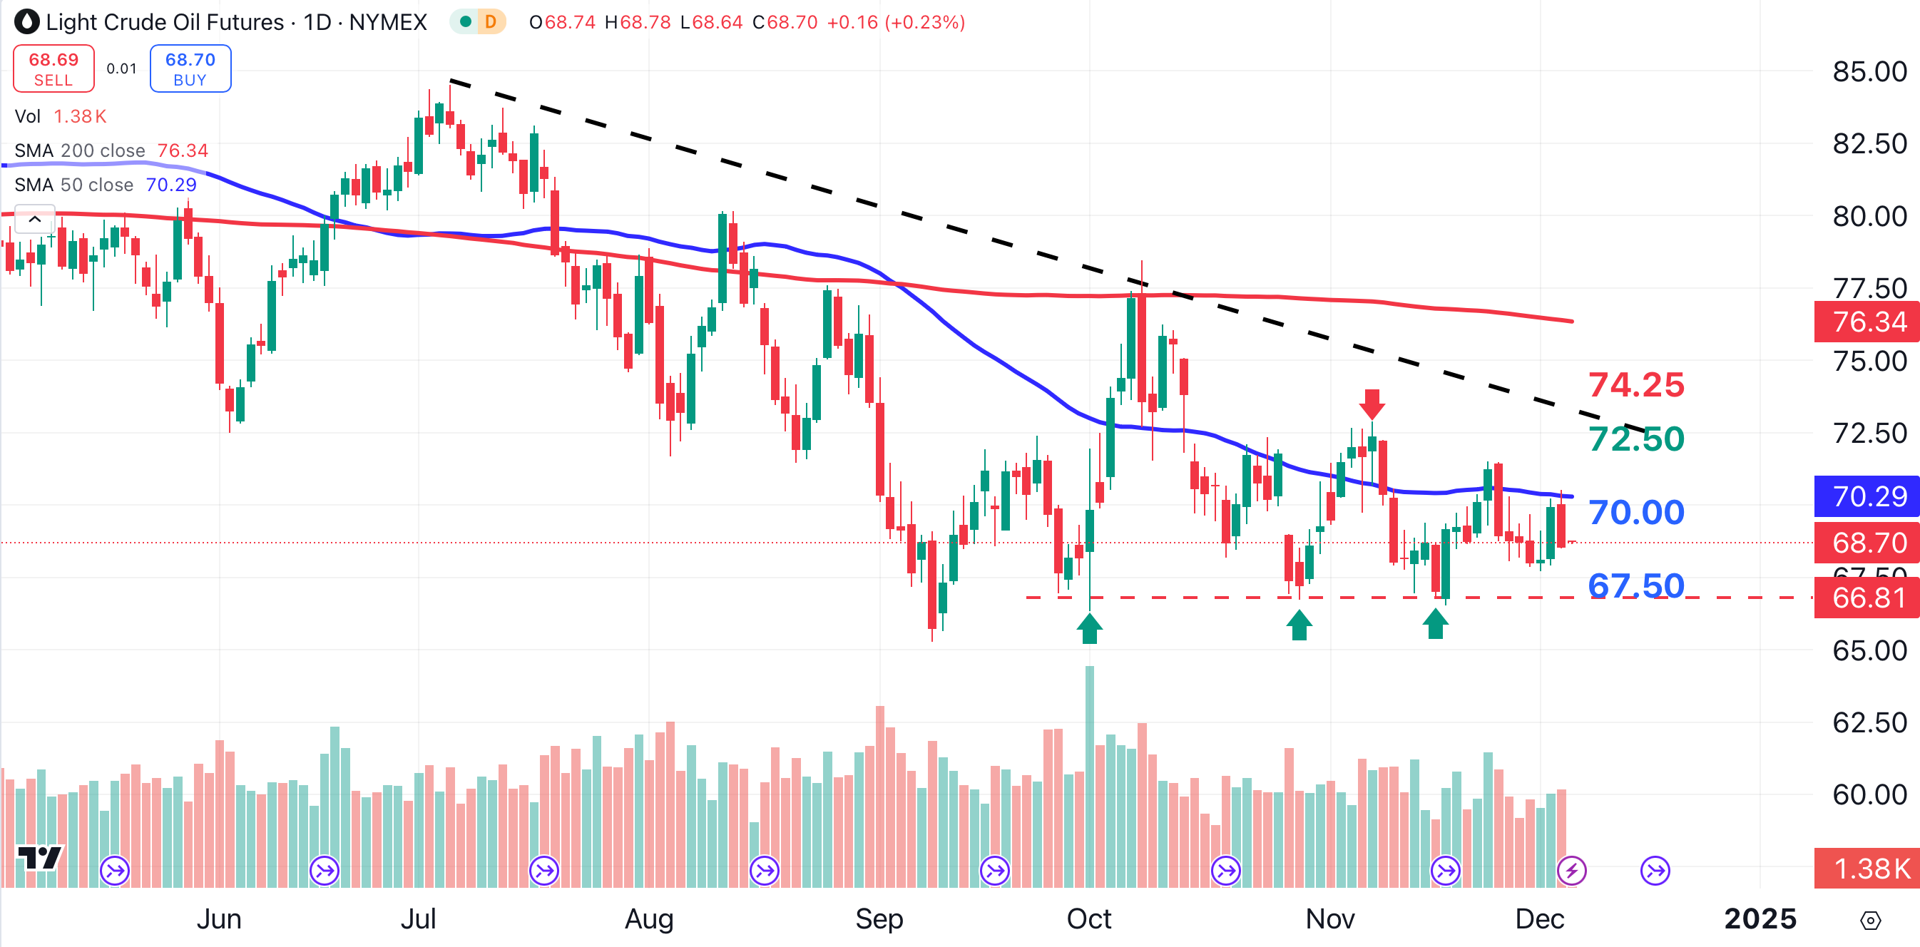
Our stop of $74.25 (red) is safely above the descending trendline, which is currently located near $73.30. Our ultimate target of $67.50 (blue) is located in an area of strong support, as the price has bounced from that level on at least three occasions (green arrows).
Why are gold, silver and crude oil all forming bearish patterns at the same time? This is likely due to continued strength in the U.S. dollar. One reason traders are buying dollars is because of turmoil in other countries.
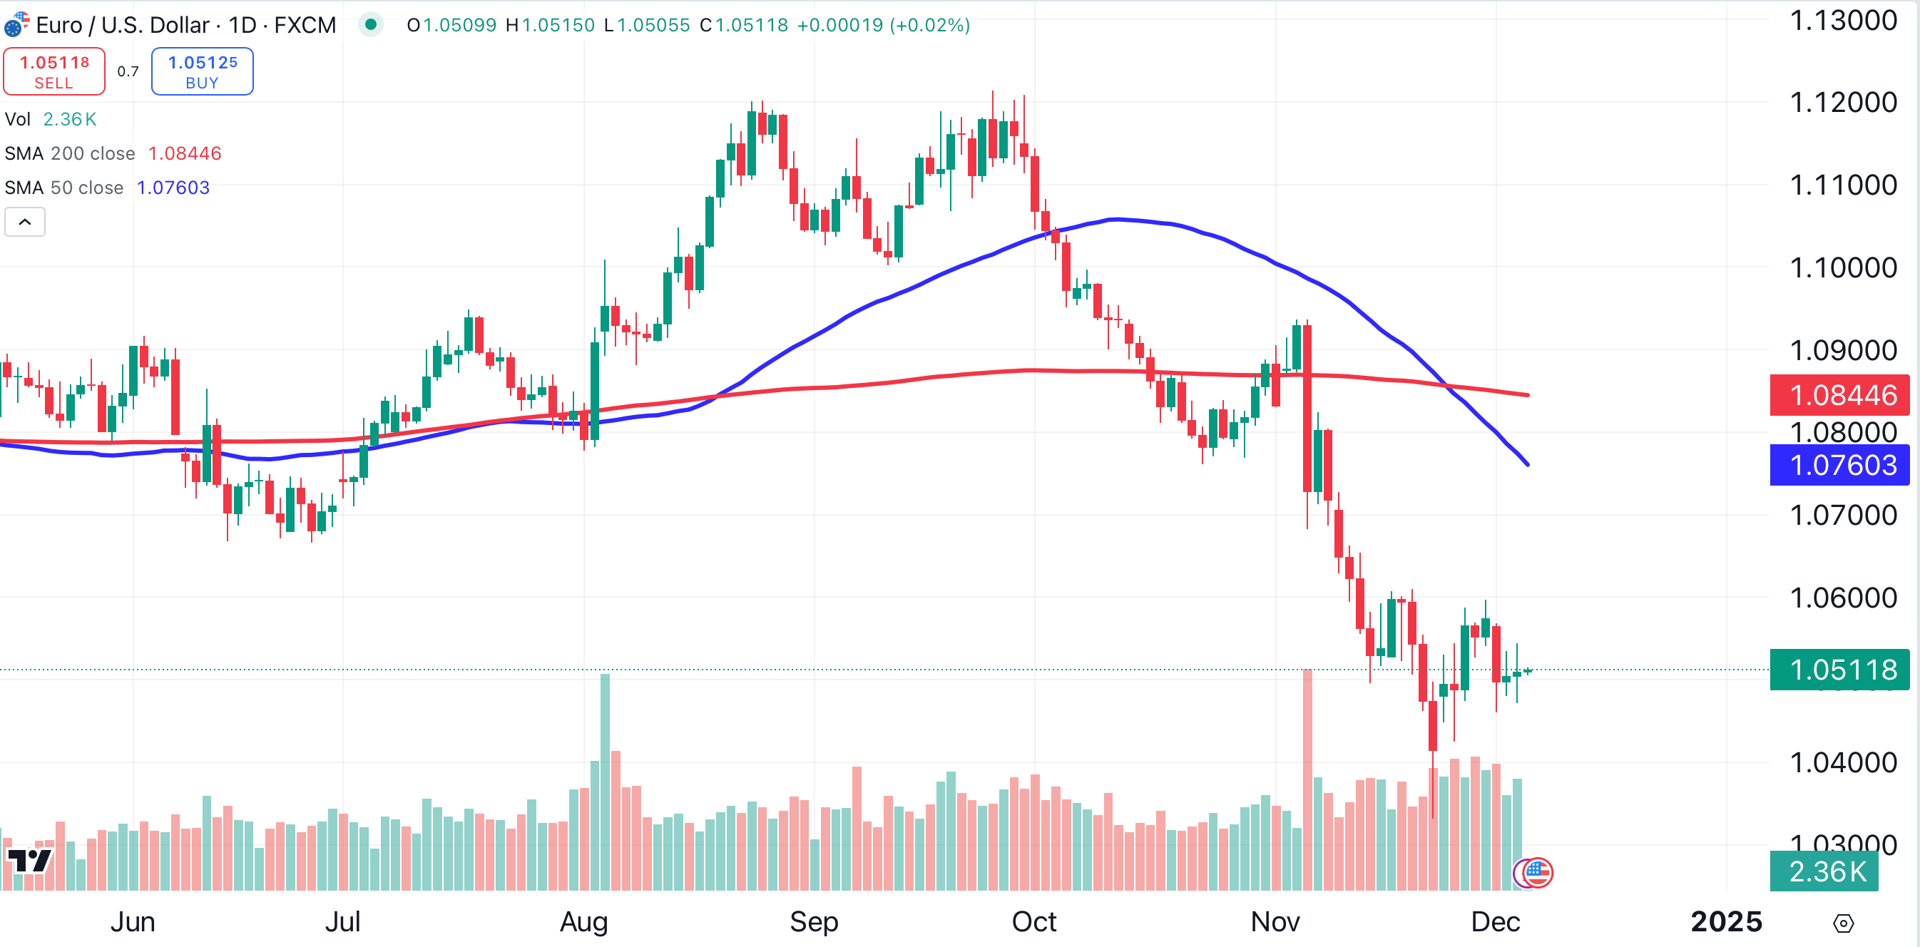
For example, the euro recently hit a two-year low against the dollar. On Wednesday, there were reports that France’s government was on the verge of collapse.
Euro’s 50-day moving average (blue) recently crossed below its falling 200-day moving average (red), a bearish momentum indicator.
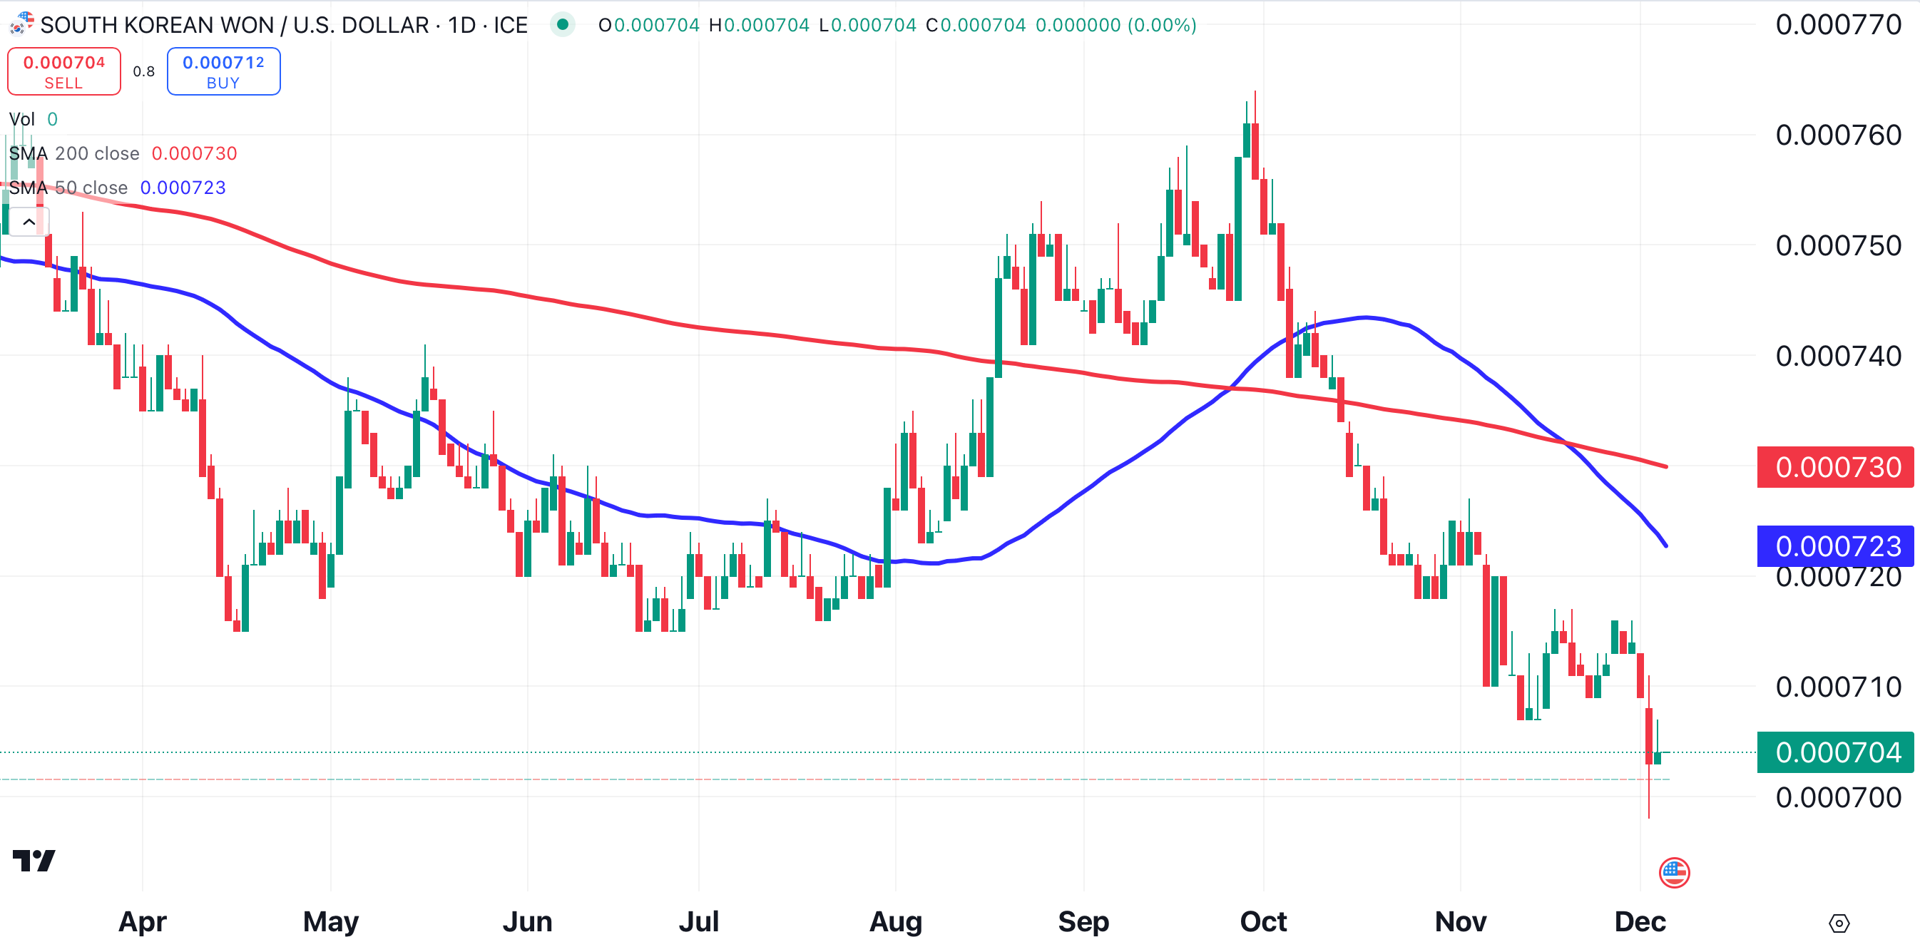
South Korea’s currency, the won, hit a two-year low this week, as the country’s president briefly declared martial law. Investors reacted by selling the currency.
The BRICs currencies are getting roughed up. The Brazilian real and the Indian rupee are both trading at all-time lows against the greenback. Russia’s ruble recently reached a two-year low against the dollar.
If turmoil in overseas currencies continues, the weakness in gold, silver, crude oil and other commodities is likely to also continue. Traders are fleeing the euro, the won and other currencies for the safety of the dollar.
At the time of publication, Ponsi was long silver
