General Mills Must Have Skipped Breakfast
The consumer food giant reported a drop in organic sales and the stock charts suggest new lows are ahead.
You've reached your free article limit
You've read 0 of 1 free Pro articles.
General Mills GIS is a world-known consumer food giant whose products include cereals, soups, pizzas, desserts and, now, pet food. The share price was under pressure Wednesday after the company reported a drop in organic sales. Let's check the conditions of the charts today.
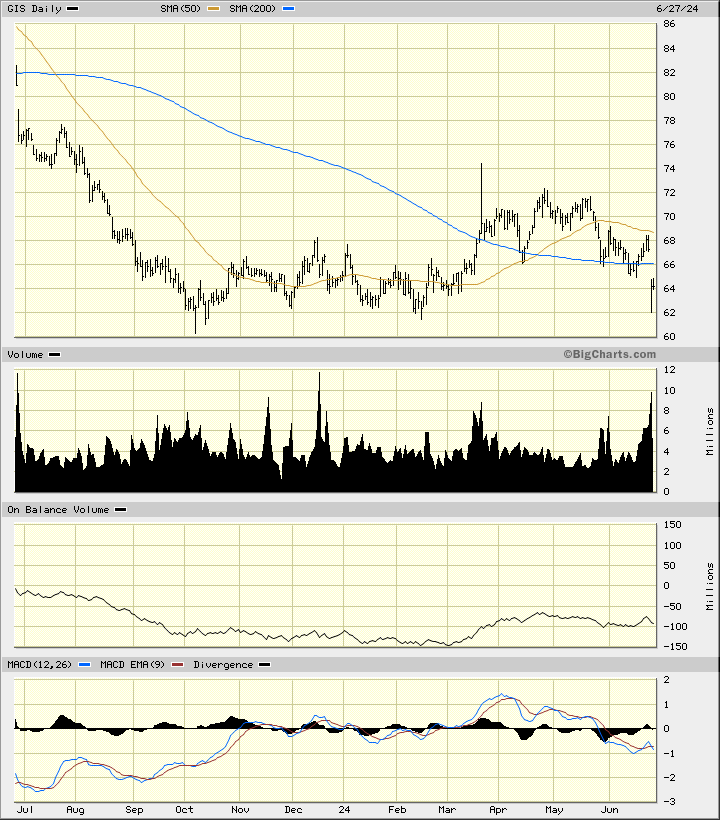
In this daily bar chart of GIS below, I can see that prices have been largely trading sideways the past 12 months. Dips to the $62 area have been bought. Prices just dipped again to the $62 area, but the price movement in the October to February timeframe is a bit different than the most recent test of the area. Early, the trading volume from September to early March was steady but I noticed a pick up in activity in late March followed by a decline. Trading volume has been increasing for the past five or so weeks as prices have declined. This kind of action is bearish and the On-Balance-Volume (OBV) line has weakened since late April. The trend-following Moving Average Convergence Divergence (MACD) oscillator is in a bearish alignment below the zero line now. The MACD oscillator was hugging the zero line earlier on this chart.
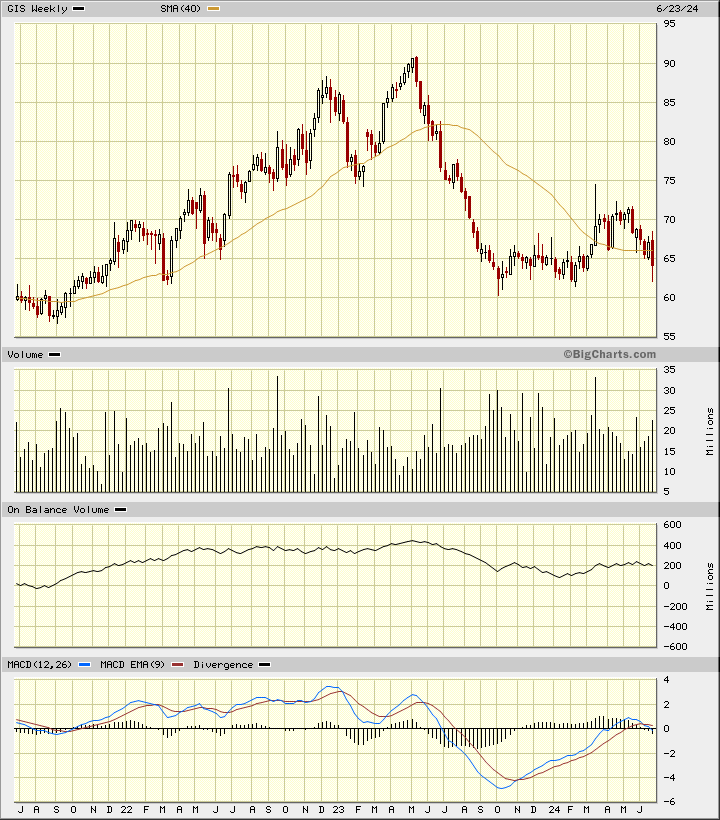
In this weekly Japanese candlestick chart of GIS below, I see a mixed picture. The two most recent candlesticks show us a bearish engulfing pattern to suggest that a move lower has started. Weekly trading volume shows an increase on the most recent decline. The OBV line has been on the defensive since last May. The MACD oscillator is crossing below the zero line for an outright sell signal.
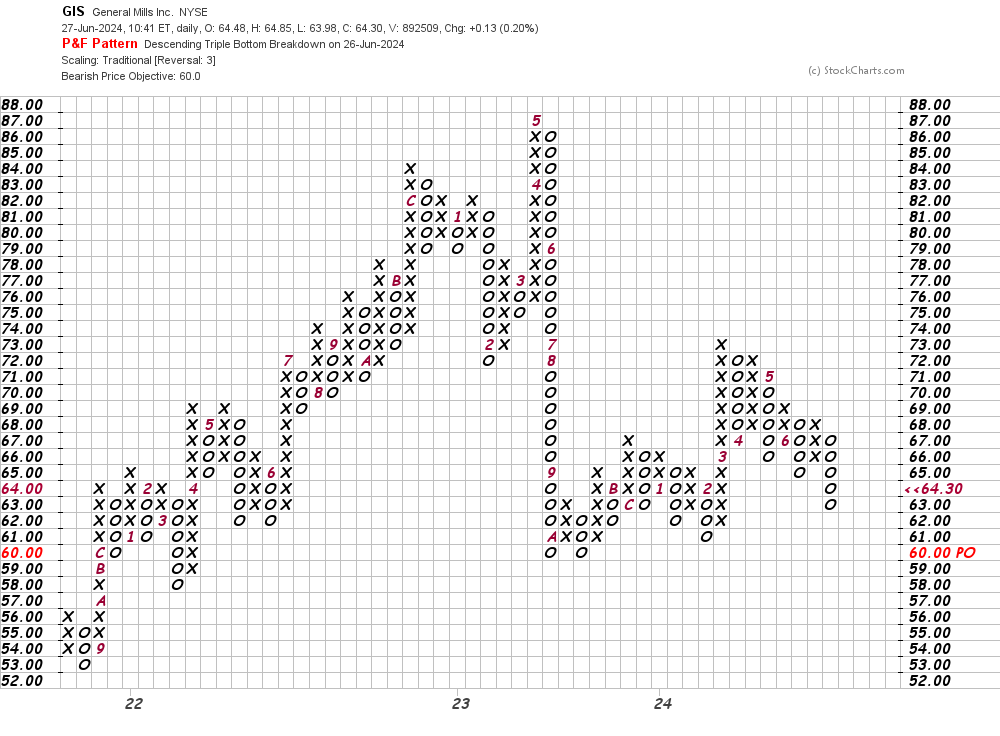
In this daily Point and Figure chart of GIS below, I can see a downside price target in the $60 area.
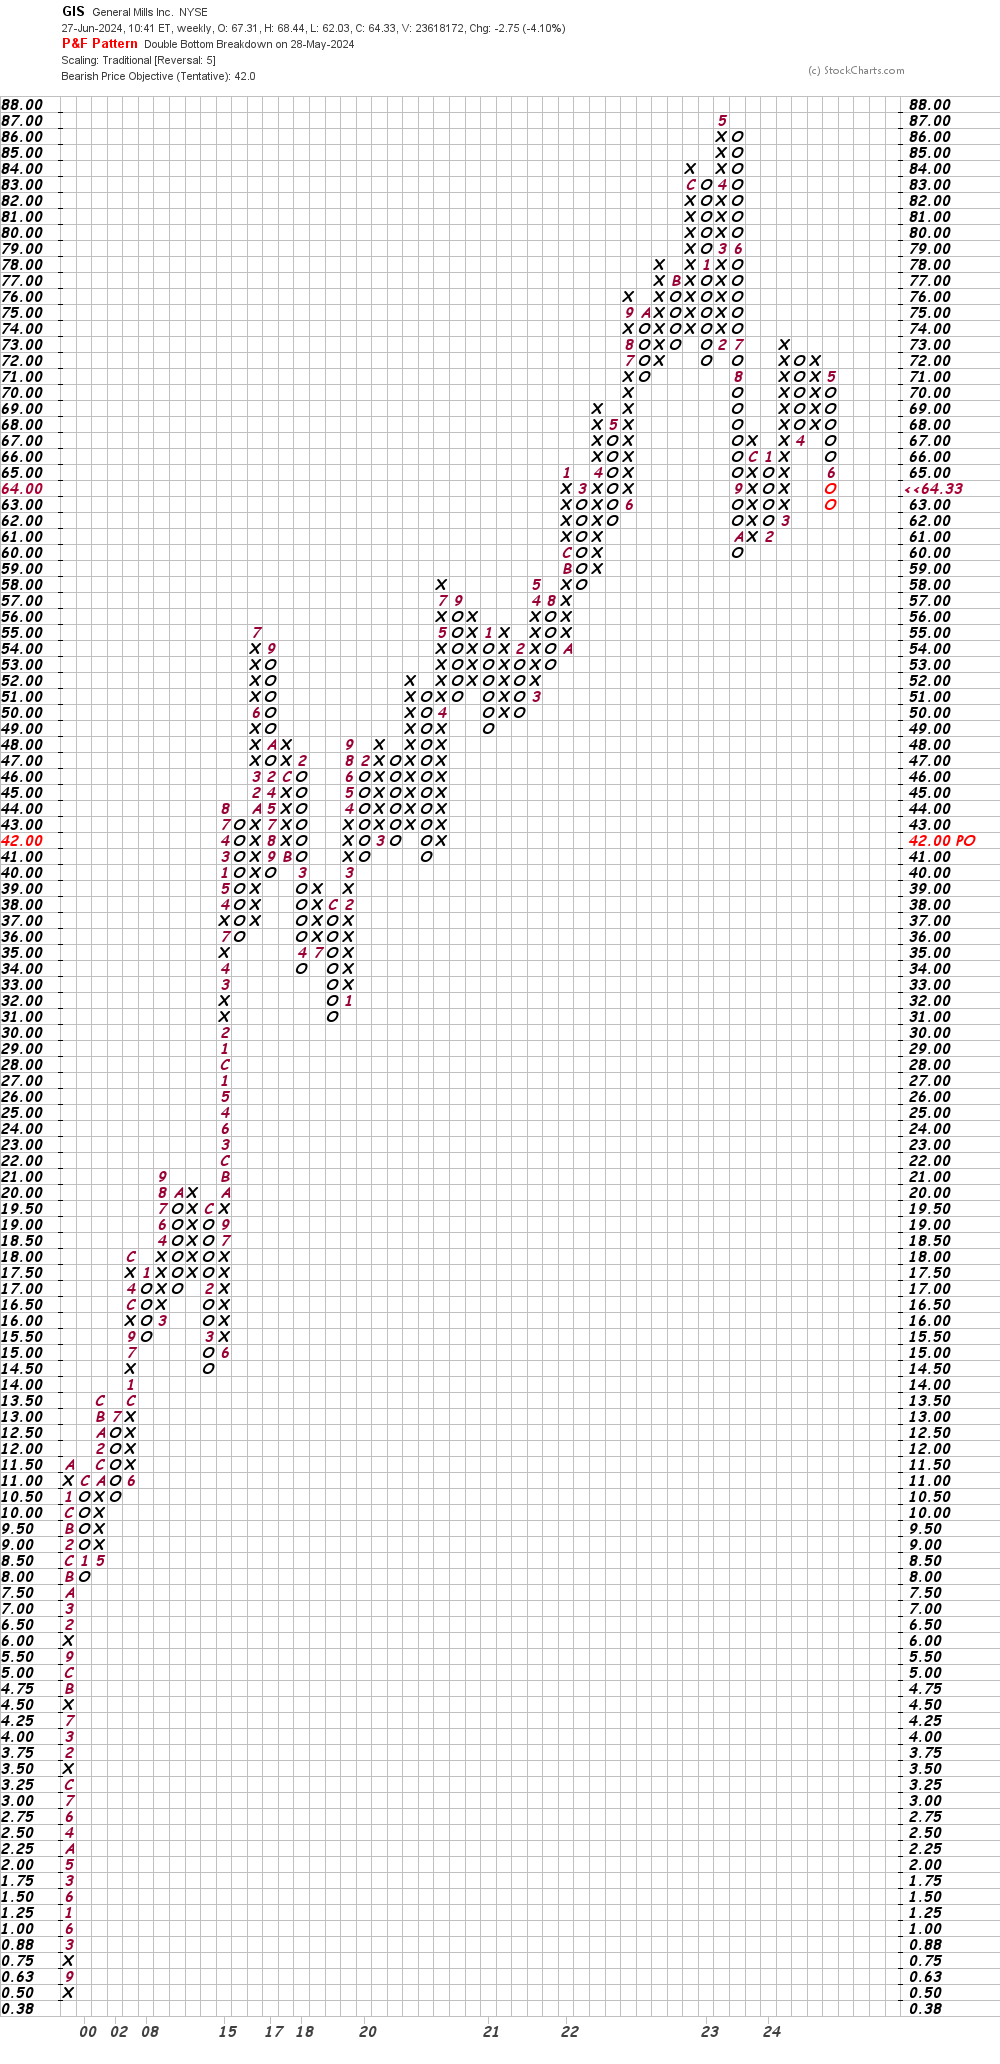
In this second Point and Figure chart of GIS below, I used weekly price data with a five box reversal filter. Here, the software shows us a price target in the $42 area. Maybe.
Bottom line strategy: GIS has found buying interest (support) in the $62 area before and it could do that again, but there are some subtle clues that suggest we could see new lows in the weeks ahead. Keep your powder dry for a better buying opportunity.
Employees of TheStreet are prohibited from trading individual securities.