Freshpet's Charts Actually Look ... Kinda Tasty
Here are my targets for FRPT and where I think the stock is going in the weeks ahead.
You've reached your free article limit
You've read 0 of 1 free Pro articles.
Freshpet FRPT has been running commercials for a while now. We currently do not have a pet, but I smile every single time I see one of these ads. Very clever. (I see a lot of clever insurance commercials, but, honestly, they are tiring after a week.)
Let's check out the charts and indicators -- and they are not stored in the refrigerator.
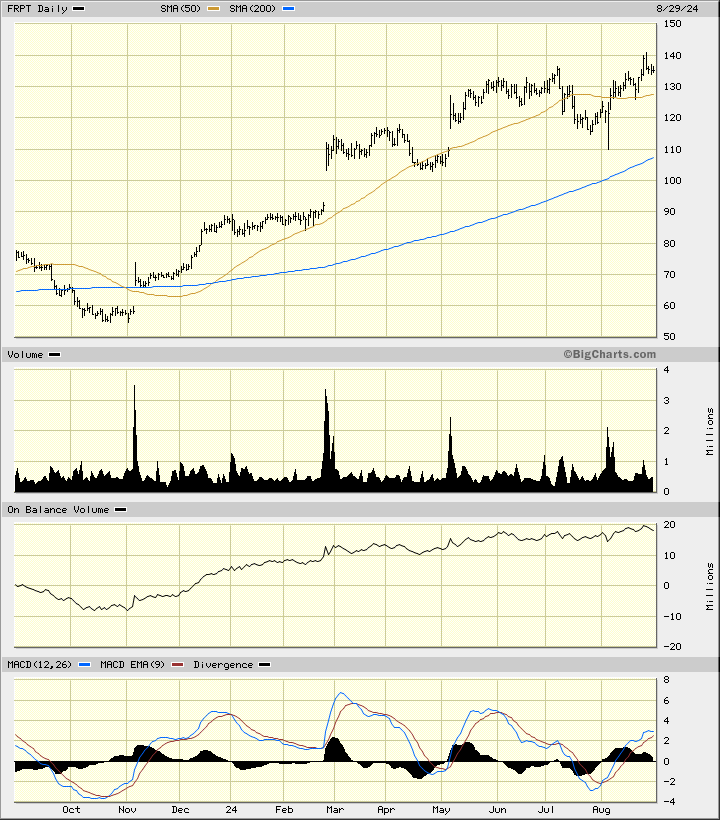
In this daily bar chart of FRPT, below, I can see that prices made a low in October and have climbed higher and higher.
Prices recently made a new high for the move up and trade above the rising 50-day moving average line and above the rising 200-day moving average line. Prices are not extended (overbought) when compared to their averages.
The daily On-Balance-Volume (OBV) line is in a bullish alignment below the zero-line. The Moving Average Convergence Divergence (MACD) oscillator is above the zero-line.
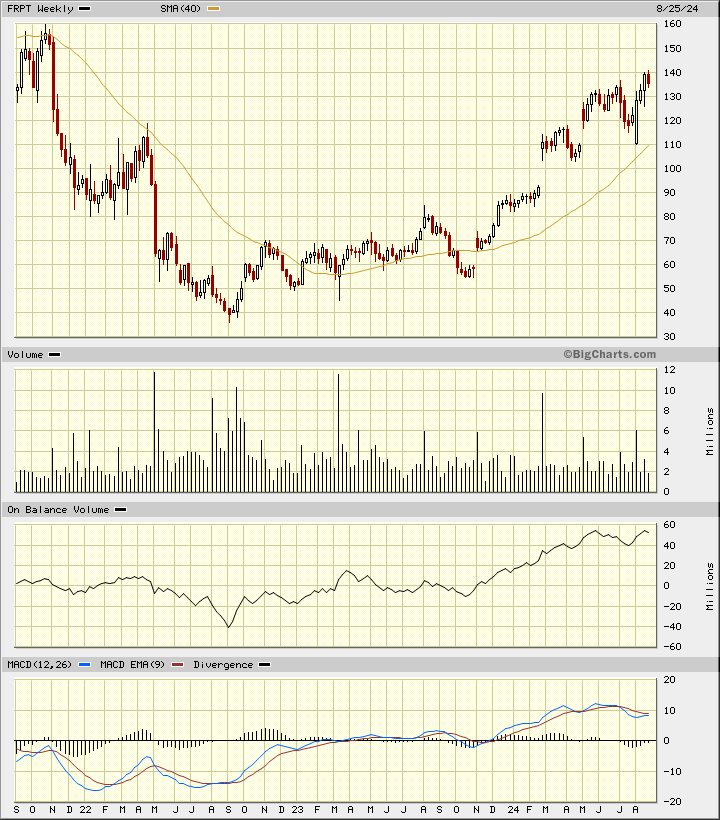
In this weekly Japanese candlestick chart of FRPT, below, I can see a base pattern in 2022 and 2023, before the rally began. Prices are trading above the rising 40-week moving average line. The weekly OBV line has been on an upward path since September 2022. The trend-following moving average convergence divergence oscillator is in a bullish alignment above the zero-line.
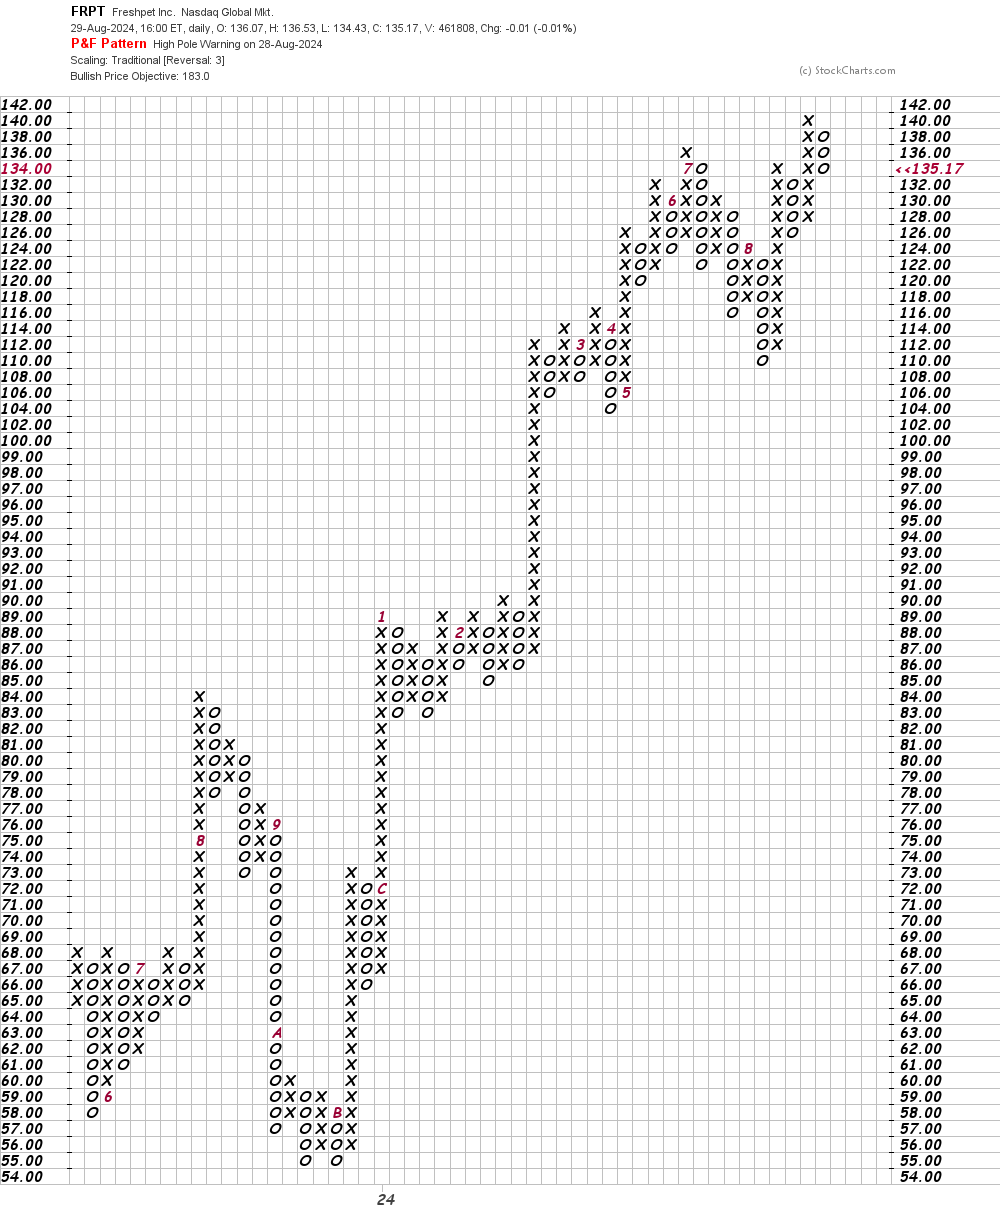
In this daily Point and Figure chart of FRPT, below, I can see a potential upside price target in the $183 area.
In this weekly Point and Figure chart of FRPT, below, I can see a price target in the $189 area.
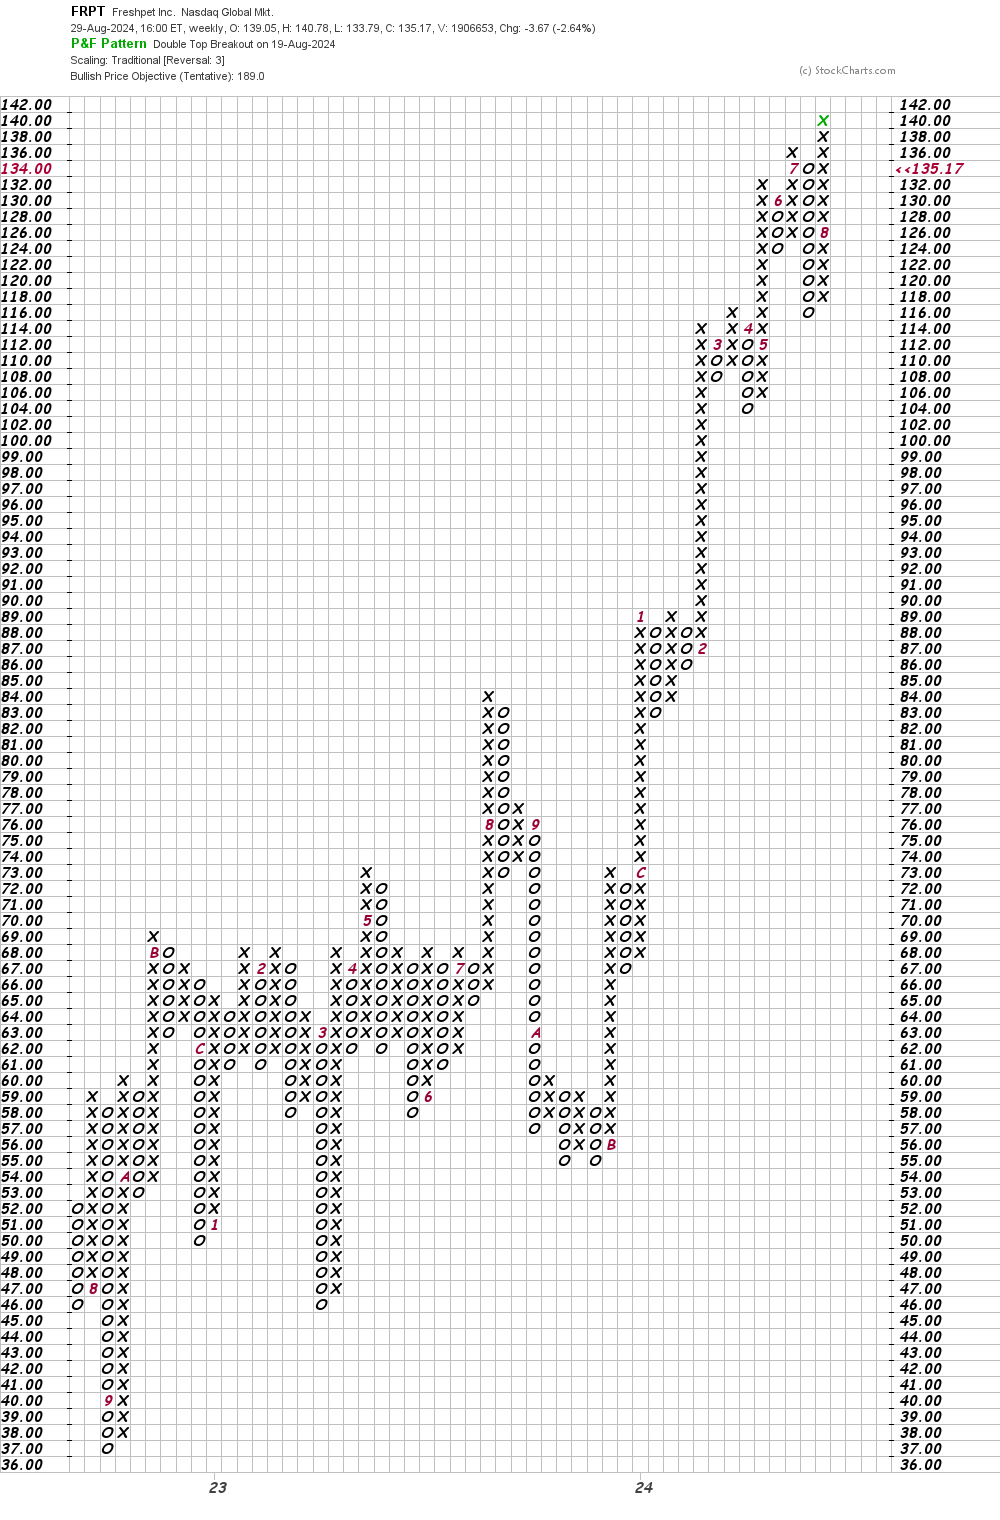
Bottom line strategy: FRPT might trade sideways in the $130-$140 area for a few weeks, but the trend is up and would expect higher share prices in the weeks ahead. Go long closer to $130, risking to $119. The $180-$190 area is my price target.
Employees of TheStreet are prohibited from trading individual securities.