Ford Is Trying to Fix its EV Business Model
The auto maker announced a delay and cancellation around its EV plans and investors seem concerned.
You've reached your free article limit
You've read 0 of 1 free Pro articles.
Ford Motor Company F announced on Wednesday that it's delaying a new plant to produce a next-generation, all-electric pickup truck. It's also canceling plans for a three-row electric SUV. Ford said it will instead prioritize hybrids.
Let's check and see the reaction in the charts to see if it points things in a better direction.
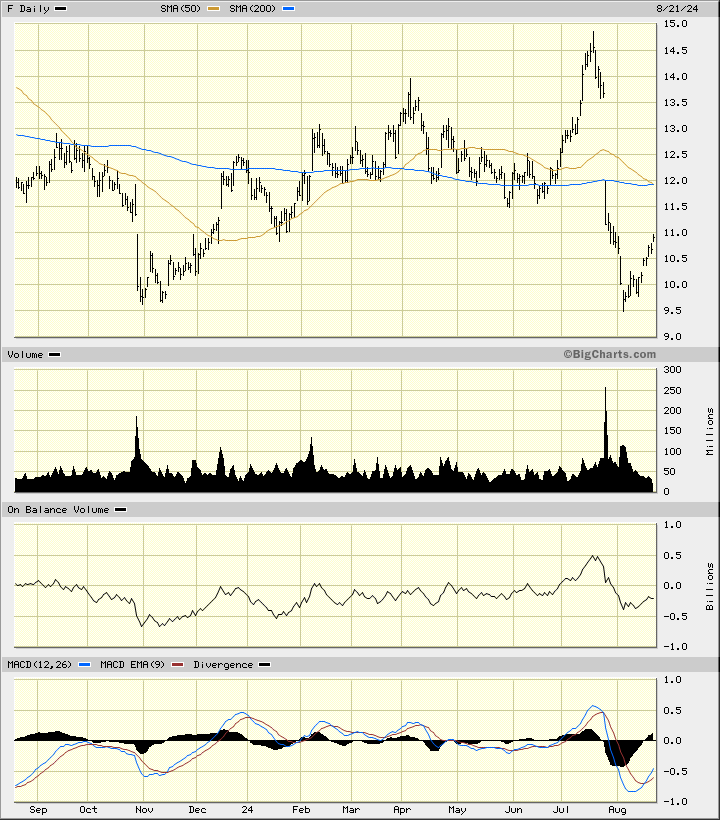
In this daily bar chart of F below, I can see that prices have bounced to the upside in August. Despite the rebound, F still trades below the declining 50-day moving average line and below the declining 200-day line. The daily On-Balance-Volume (OBV) line has followed prices lower from July into August. The Moving Average Convergence Divergence (MACD) oscillator is below the zero line but has crossed to the upside for a cover-shorts buy signal.
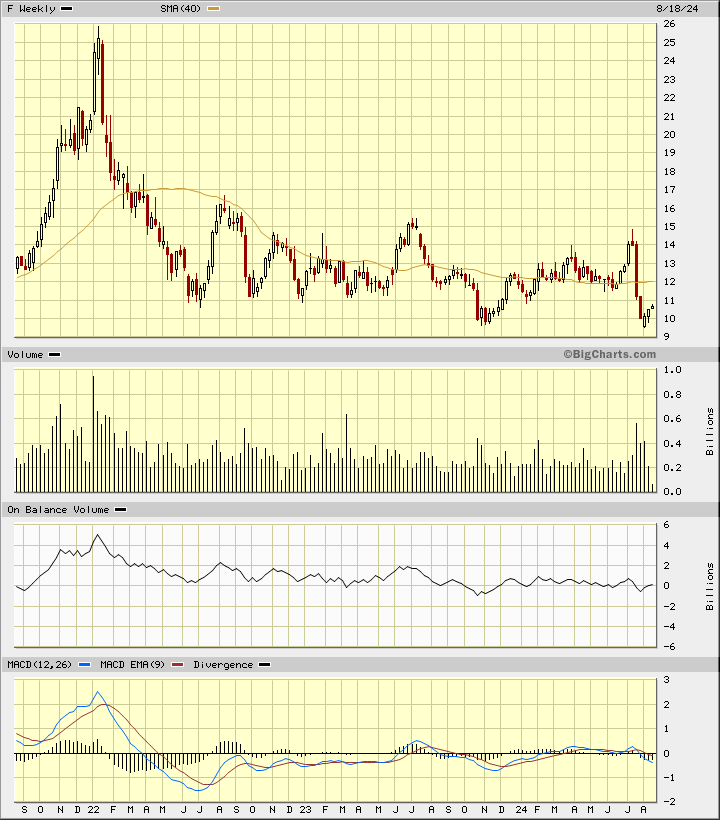
In this weekly Japanese candlestick chart of F below, I can see a chart that is still struggling to hammer out a bottom. Prices made a new low for the move down in early August and trades below the 40-week moving average line. The weekly OBV line has been flat/neutral the past two years. The weekly MACD oscillator is just below the zero line.
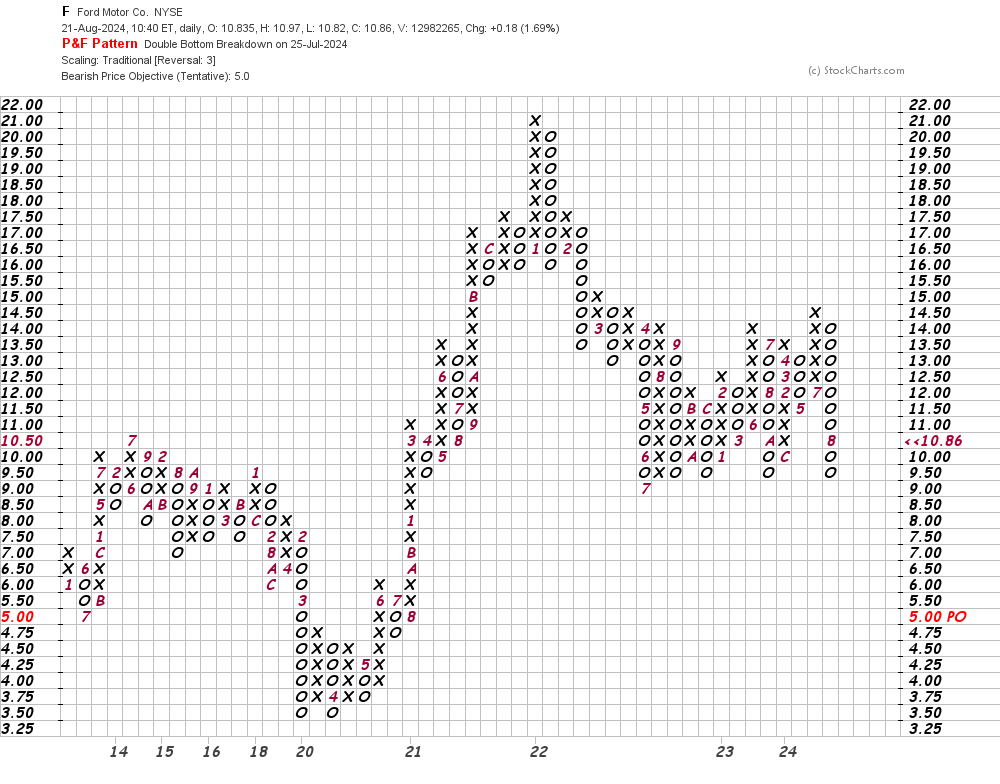
In this daily Point and Figure chart of F below, I can see that the software is suggesting we could see a downside price target in the $5 area. A trade at $8.50 will refresh the downtrend.
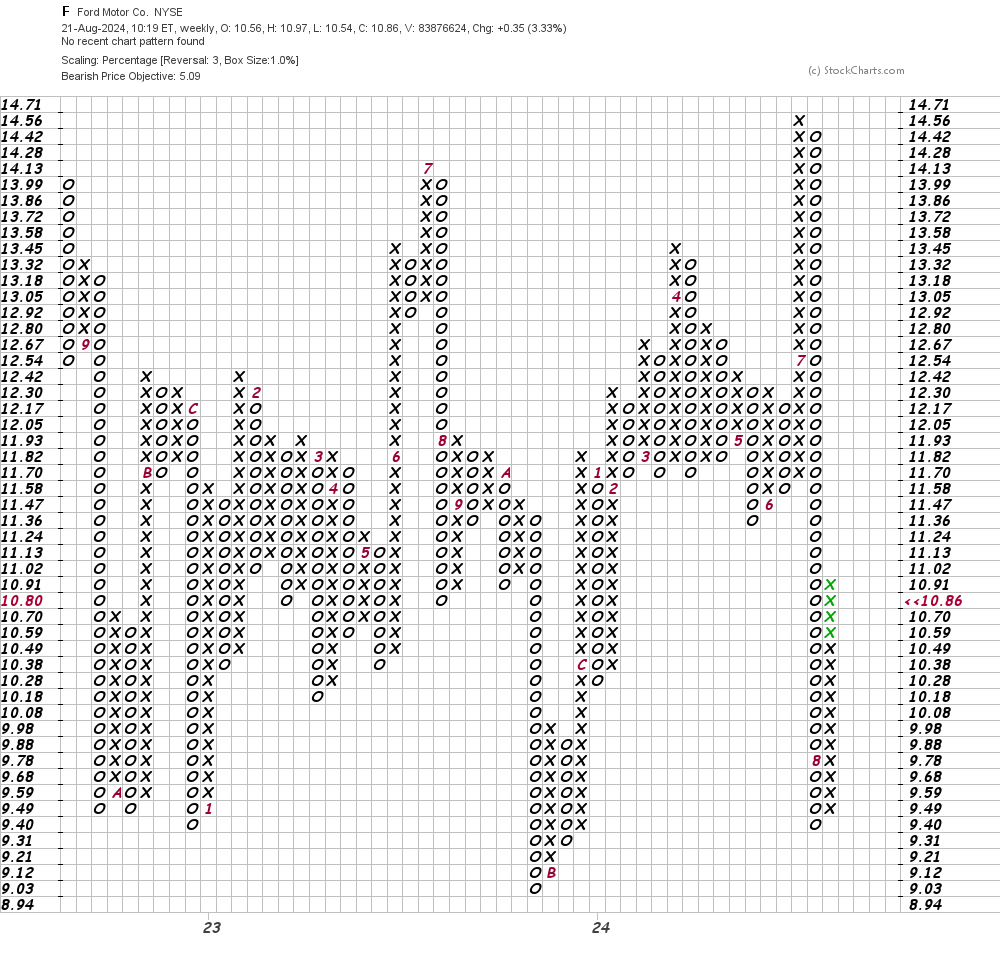
In this weekly Point and Figure chart of F below, I can also see a downside price target in the $5 area.
Bottom line strategy: F seems to be a work in progress and so are the charts.
Employees of TheStreet are prohibited from trading individual securities.