Foot Locker Looks Ready to Jump Higher
The athletic footwear and apparel retailer might be lacing up for a stock price rally.
You've reached your free article limit
You've read 0 of 1 free Pro articles.
Shares of Foot Locker FL could be laced up for a rally. The company is a specialty retailer of athletic footwear and apparel.
Let's check the charts.
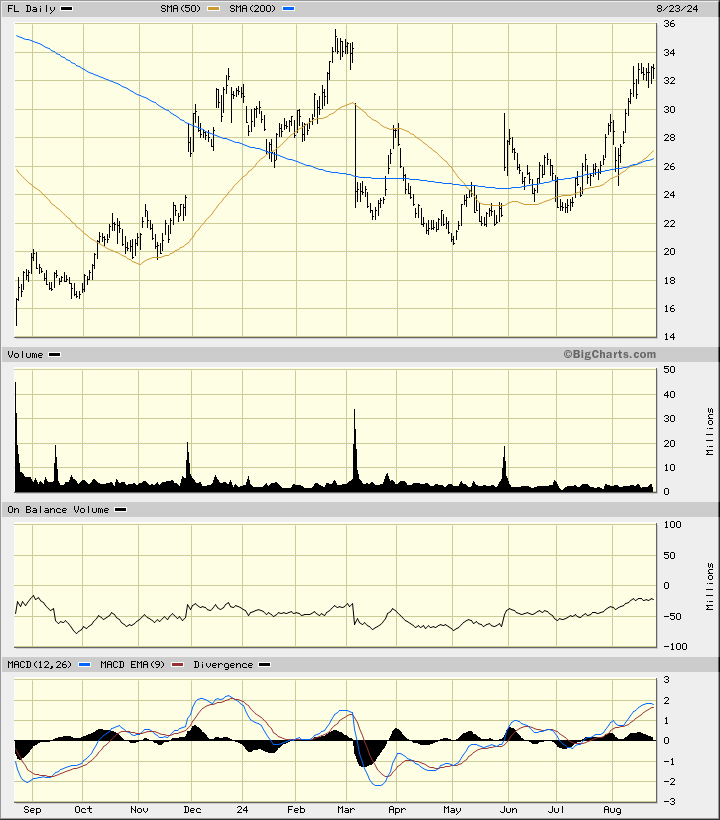
In this daily bar chart of FL below, I can see a cup- or saucer-like pattern the past six months. Prices are now trading above the rising 50-day moving average line and above the rising 200-day moving average line. The daily On-Balance-Volume (OBV) line has a positive trend since May and tells me that buyers of FL have been more aggressive. The trend-following Moving Average Convergence Divergence (MACD) oscillator is above the zero line but it shows some narrowing in recent days.
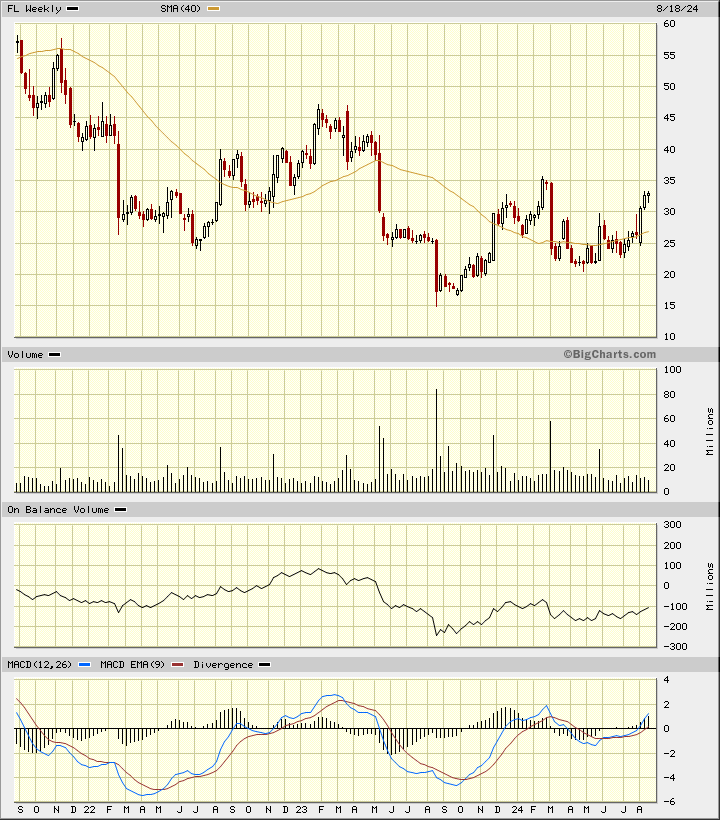
In this weekly Japanese candlestick chart of FL below, I can see a longer-term downward sloping trend but the indicators have been improving since late 2023. Prices are trading above the rising 40-week moving average line. The weekly OBV line has been doing better the past year. The MACD oscillator is now above the zero line telling me that the up move has been gaining strength.
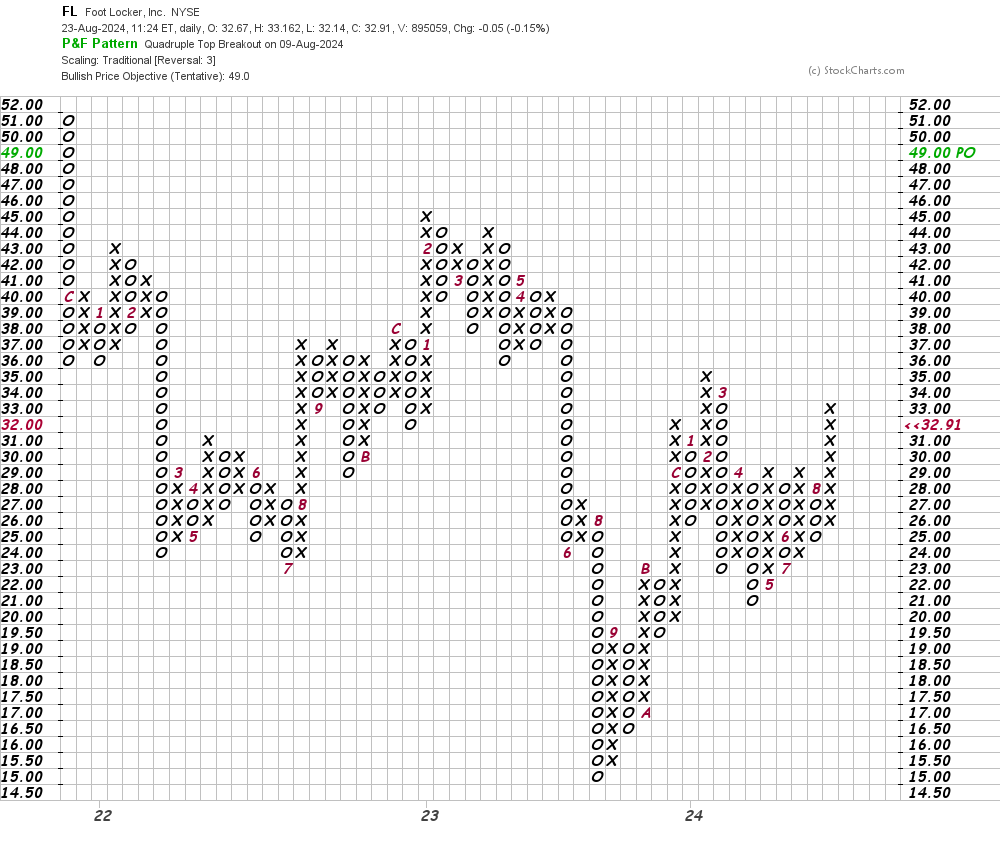
In this daily Point and Figure chart of FL below, I can see an upside price target in the $49 area.
In this weekly Point and Figure chart of FL below, I see a price target in the $53 area — higher than the daily chart target above.
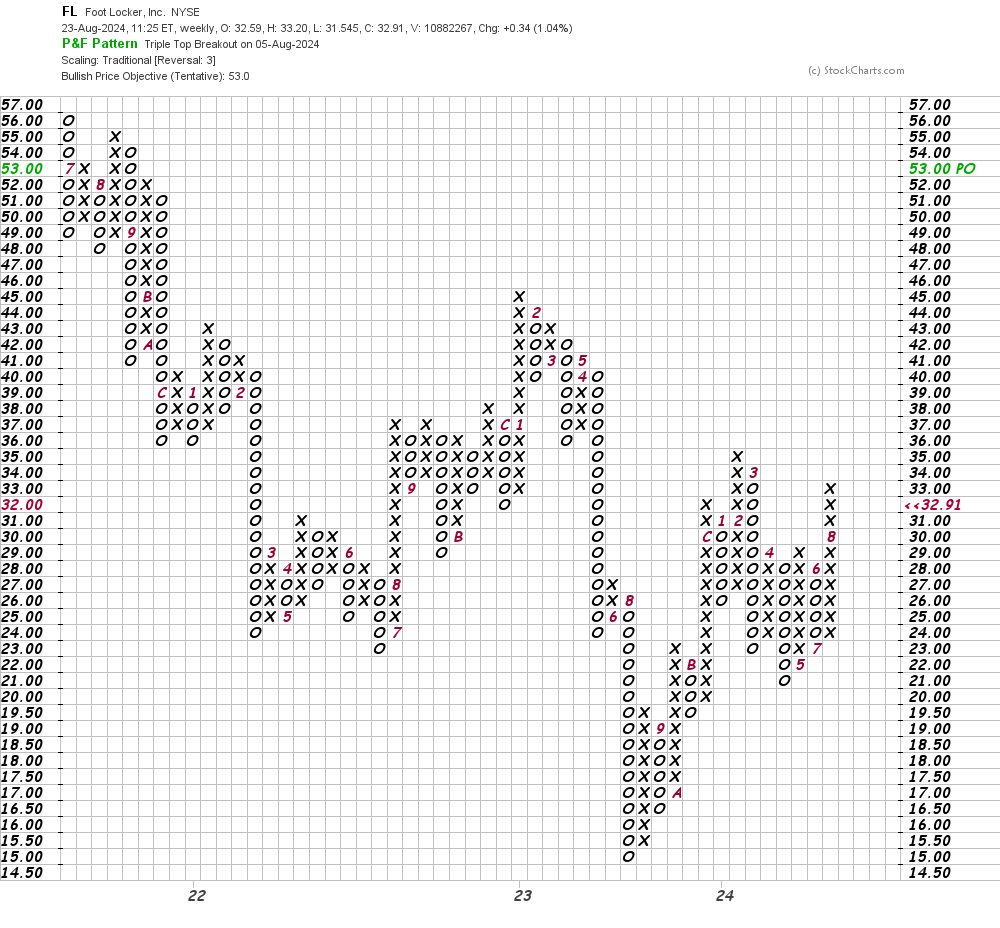
Bottom line strategy: Traders could go long FL on a dip to $30 risking toe $26. The $50 area is my price target.
Employees of TheStreet are prohibited from trading individual securities.