Firms Cut Lululemon Price Targets: Our Take
The athleisure company has struggled to make a bottom formation on the stock charts.
You've reached your free article limit
You've read 0 of 1 free Pro articles.
Two sell-side firms cut their price targets for the popular athletic wear firm of Lululemon LULU. Stifel SF cut its price target to $370 per share from $416 and Citigroup C cut the stock to $270 from $300.
Let's check out the charts and indicators before our next yoga class.
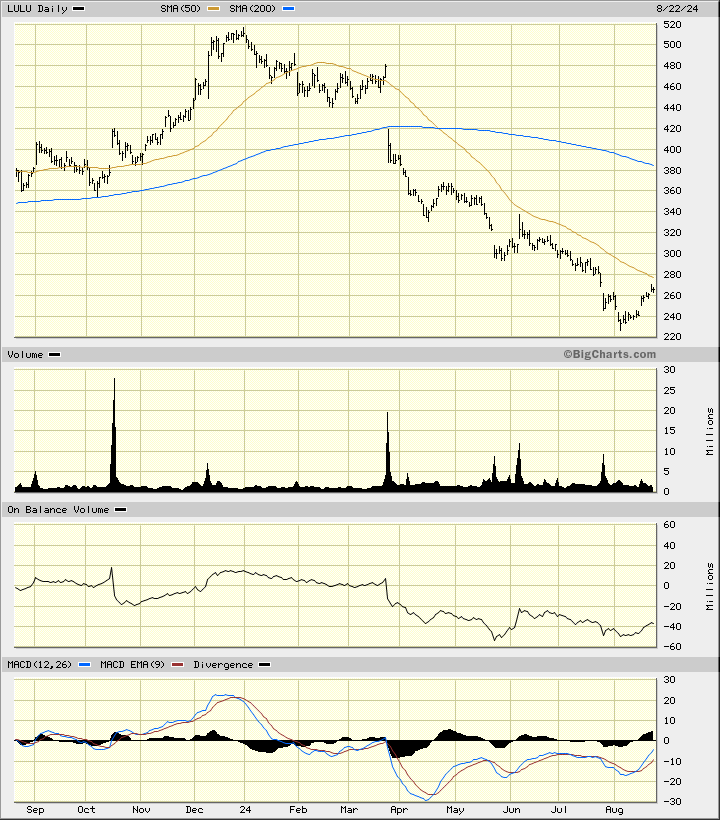
In this daily bar chart of LULU below, I can see that prices have been on a downward path since December. LULU trades below the negatively sloped 50-day moving average line. The slower-to-react 200-day moving average line also has a bearish slope. The On-Balance-Volume (OBV) line made a decline into late May and then moved sideways. The OBV line made a slightly higher low in August than in May. The Moving Average Convergence Divergence (MACD) oscillator has been improving since making a low in April but it still remains below the zero line.
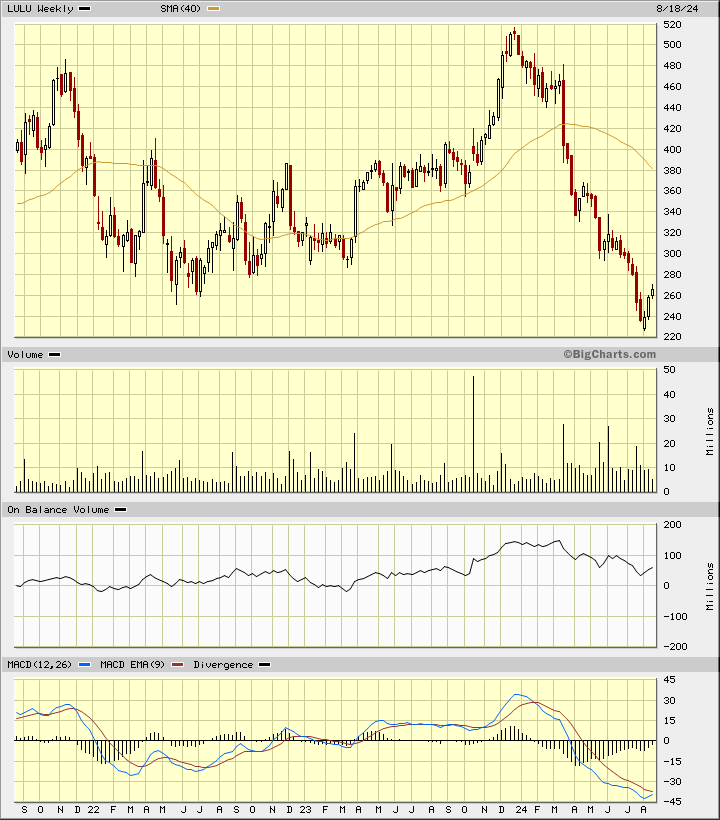
In this weekly Japanese candlestick chart of LULU below, I can see a steep decline to perhaps a low but no signs of a base yet. Prices are trading below the declining 40-week moving average line. The weekly OBV line is trending lower. The MACD oscillator is in a bearish alignment below the zero line.
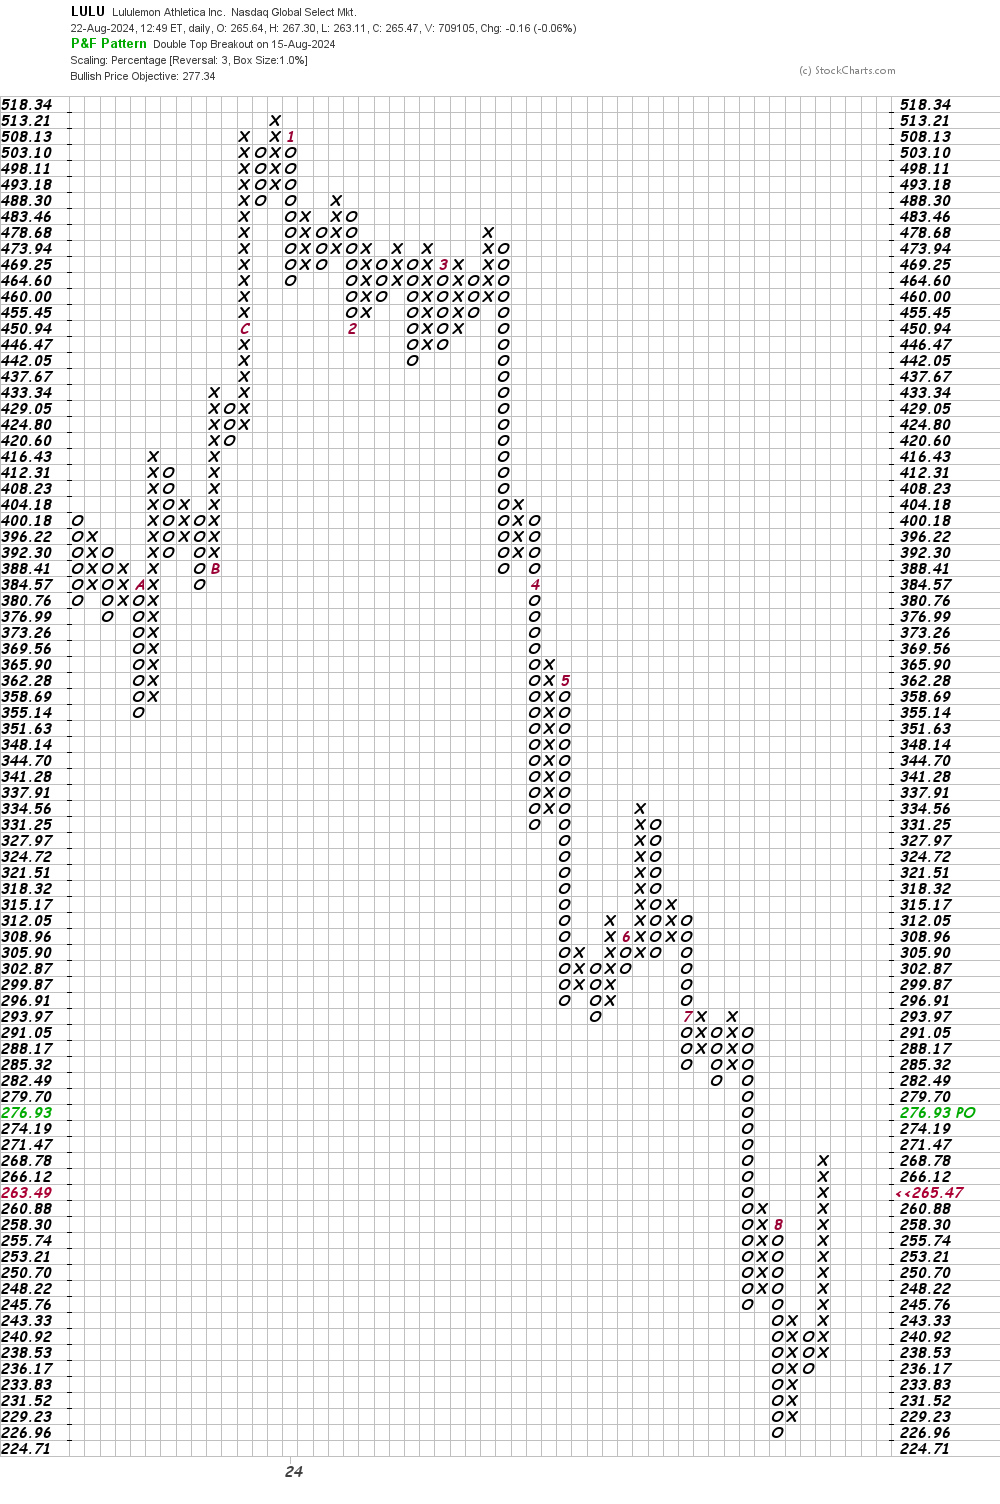
In this daily Point and Figure chart of LULU below, I can see a nearby upside price target.
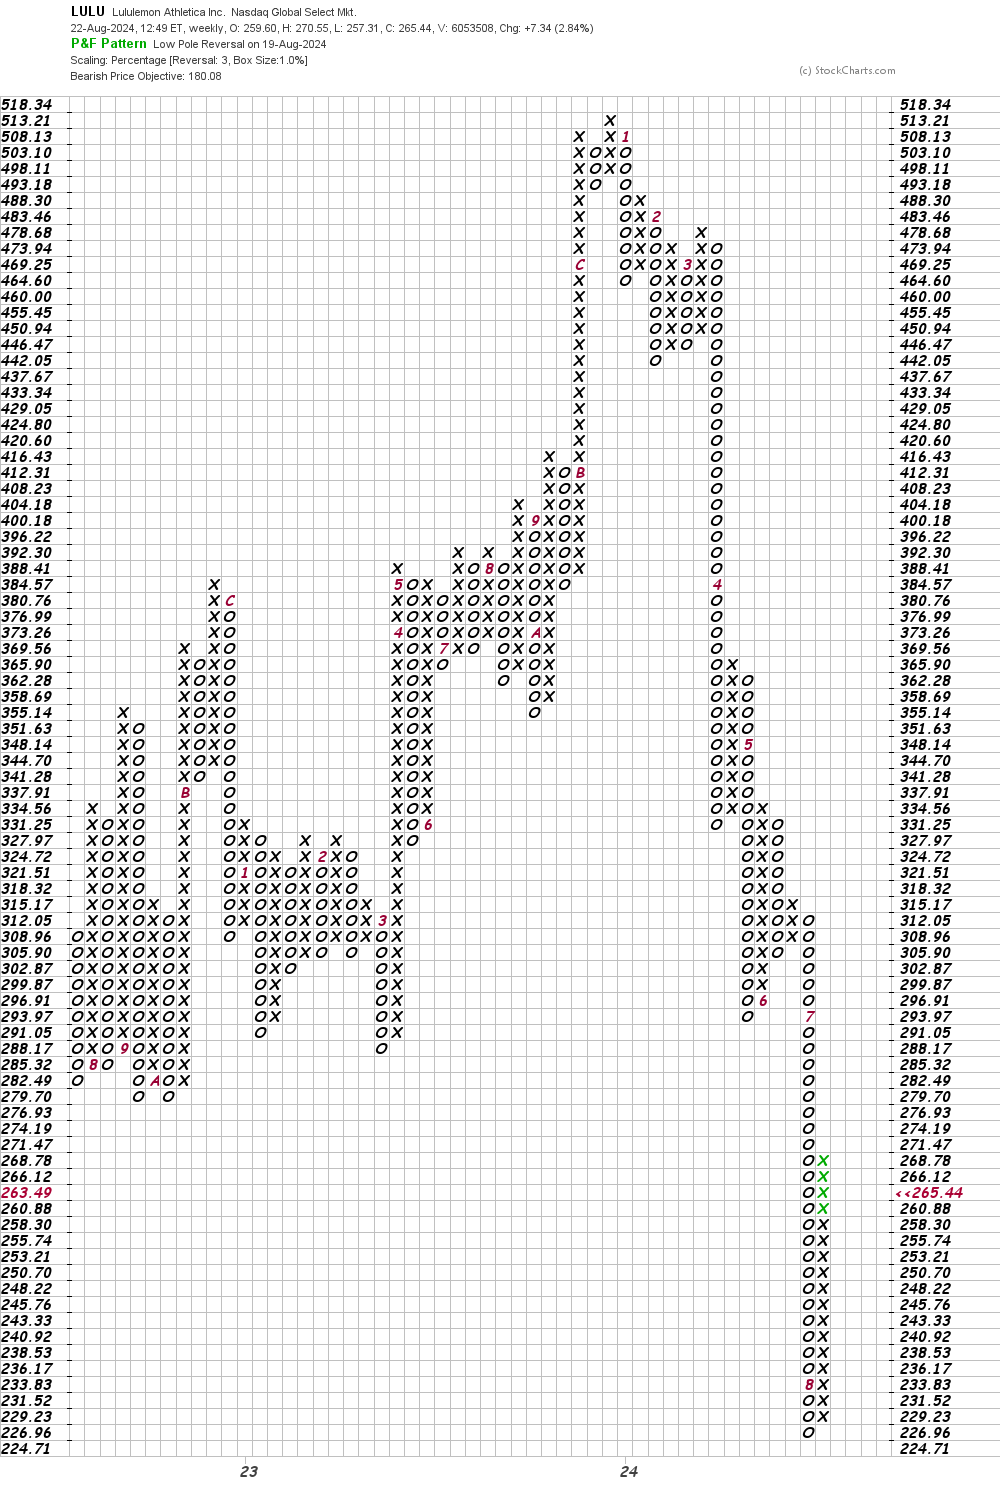
In this weekly Point and Figure chart of LULU below, I can see a potential downside price target in the $181 area.
Bottom line strategy: Without a high volume low on the chart or a bottom formation, I cannot recommend purchase of LULU.
Employees of TheStreet are prohibited from trading individual securities.