FedEx Has Delivered Lately, but Will Its Bounce Continue After Earnings?
The charts are favorable going into its results.
You've reached your free article limit
You've read 0 of 1 free Pro articles.
FedEx Corp. FDX is scheduled to report its fiscal second-quarter results after the close of trading here on Tuesday. Will the shipping giant drop off its numbers on our doorstep and email us a photo, or will there be a conference call with sell side analysts and others?
Let's check the charts and indicators of FedEx, which I last wrote about on Sept. 29, to see where its shares may go from here.
In this daily bar chart of FDX, below, I can see a positive trend the past year. Prices have made higher lows in March, May and October and higher highs in February, July and December. Prices trade above the rising 50-day and 200-day moving average lines. The daily On-Balance-Volume (OBV) line made a low in October and shows the start of a new trend higher. The Moving Average Convergence Divergence (MACD) oscillator is in a bullish trend above the zero line.
In this weekly Japanese candlestick chart of FDX, below, I can see a "V" bottom for FDX in late 2022. Prices now trade above the rising 40-week moving average line. The weekly OBV line shows us a longer-term rise, telling me that buyers of FDX have been more aggressive than sellers. The MACD oscillator has turned upward to a fresh outright buy signal.
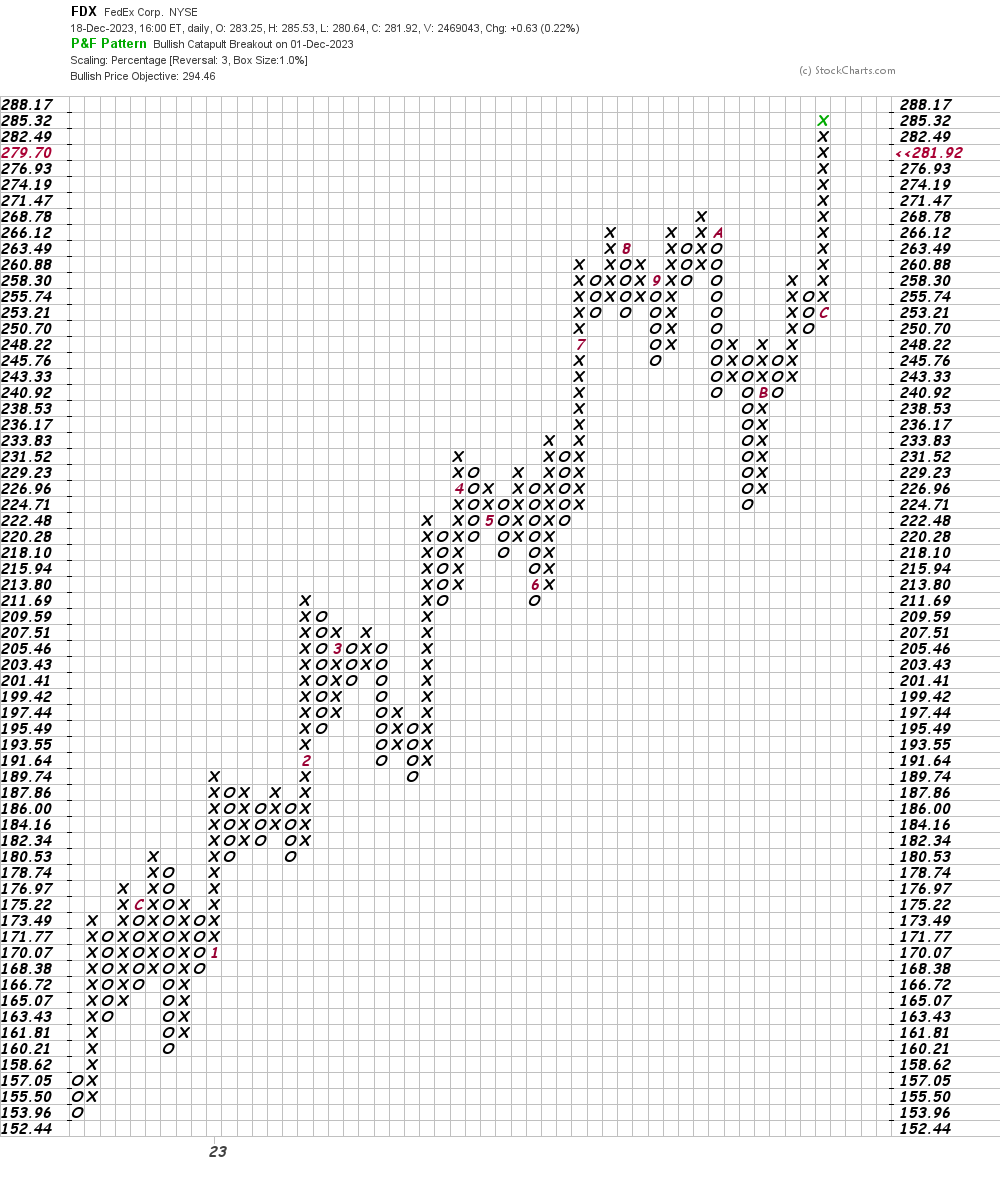
In this daily Point and Figure chart of FDX, below, I can see an upside price target in the $294 area.
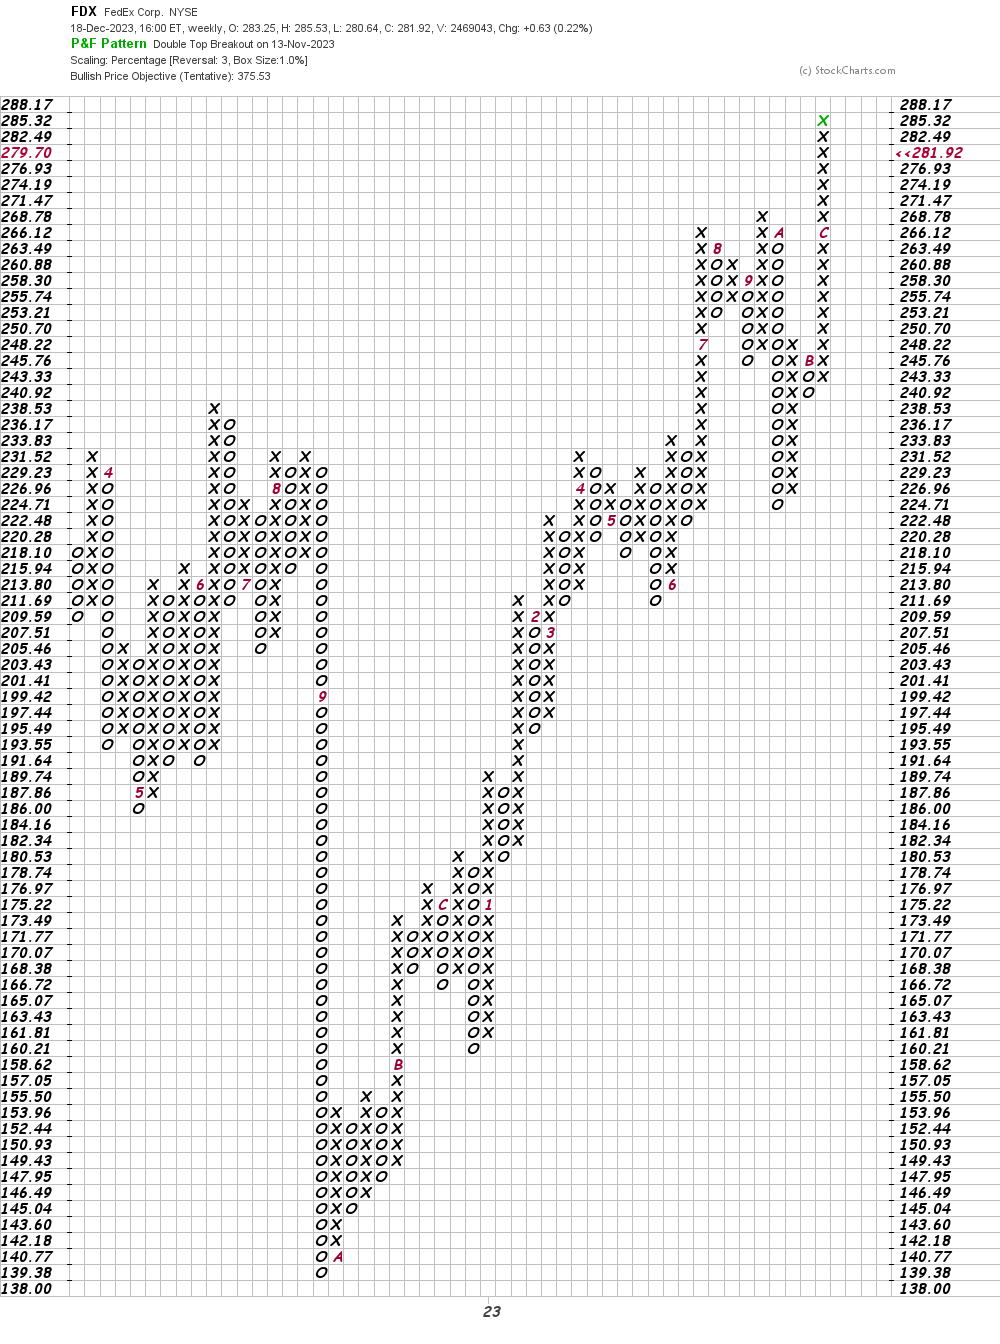
In this weekly Point and Figure chart of FDX, below, I can see a price target in the $376 area.
Bottom line strategy: I don't know what FDX will report to shareholders this evening, but traders could probe the long side of FDX on a dip to the $275 area risking to $265. The $294-$300 area is my price target for now.
Employees of TheStreet are prohibited from trading individual securities.