DXC Technology Jumps on Buyout Talk: What to Watch
Shares have been on a downward path, but surged sharply higher the past two trading days on news of Apollo-Kyndryl bid.
You've reached your free article limit
You've read 0 of 1 free Pro articles.
Shares of DXC Technology DXC jumped recently on reports of a joint bid for the company from buyout firm Apollo Global APO and Kyndryl Holdings KD, an information technology services provider.
Let's check out the charts of DXC, which helps "global companies run their mission-critical systems and operations while modernizing IT, optimizing data architectures and ensuring security."
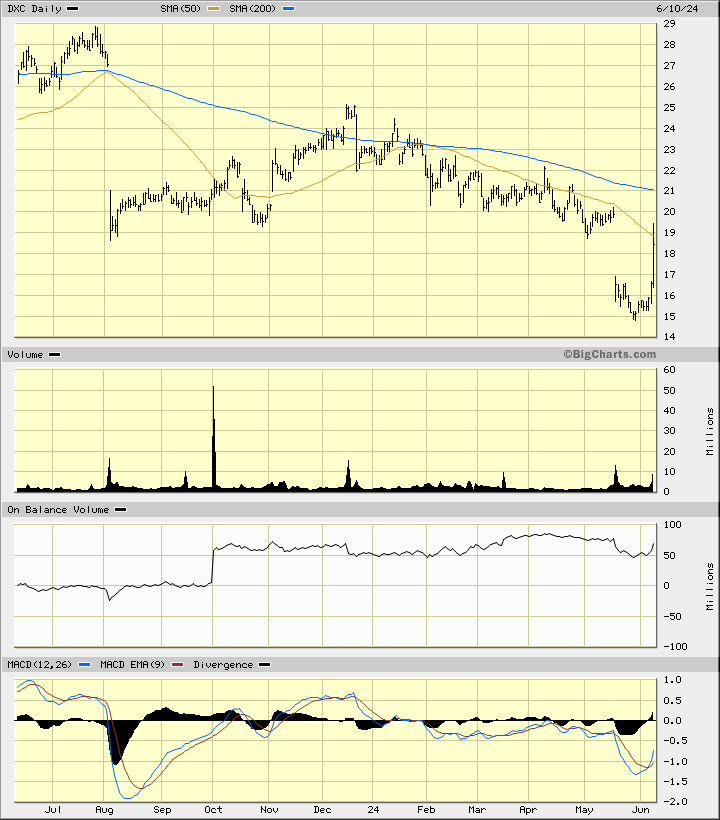
In the daily bar chart of DXC, below, I can see that prices have been on a downward path but surged sharply higher in the past two trading days. The shares have rallied to the downward sloping 50-day moving average line and are close to a test of the declining 200-day moving average line.
The On-Balance-Volume (OBV) line has been a choppy sideways trend since October. The Moving Average Convergence Divergence (MACD) oscillator is below the zero line but has crossed to the upside for a cover shorts buy signal.
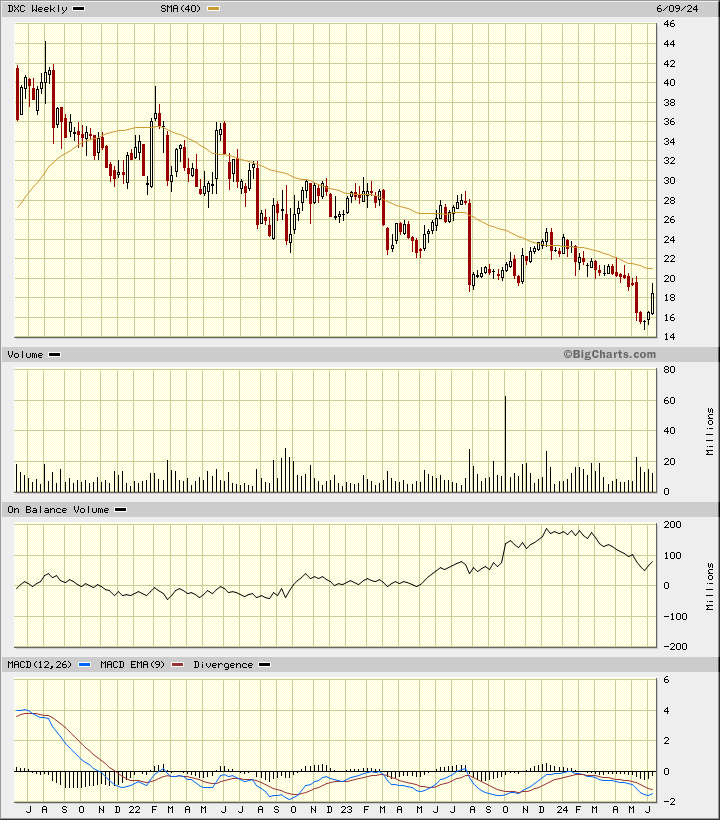
In the weekly Japanese candlestick chart of DXC, below, I can see a long-term downtrend. Prices trade below the negatively sloped 40-week moving average line.
The trading volume has been more active the past 10 months telling me that traders have been voting with their feet. The weekly OBV line has been in a downtrend since the beginning of the year as traders have become more aggressive sellers of DXC. The MACD oscillator is bearish.
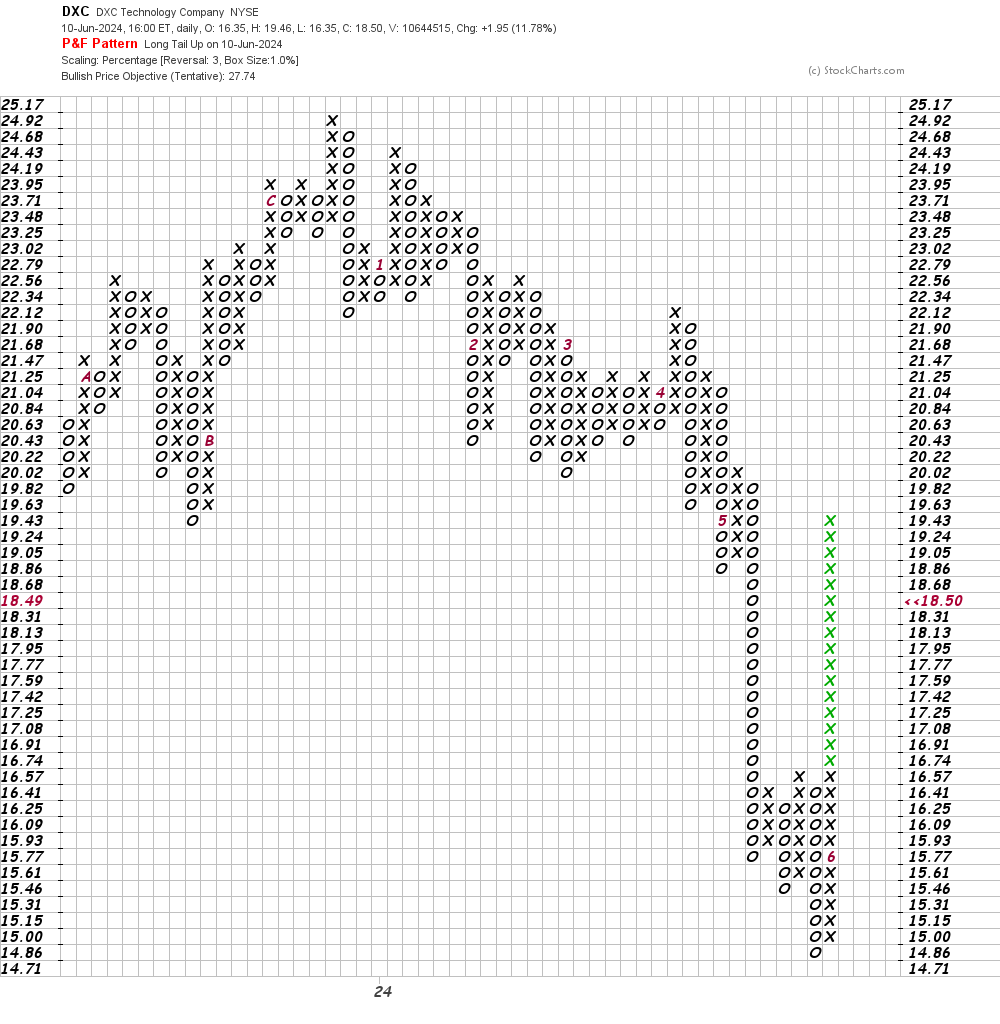
In this daily Point and Figure chart of DXC, below, I can see a potential upside price target in the $28 area.
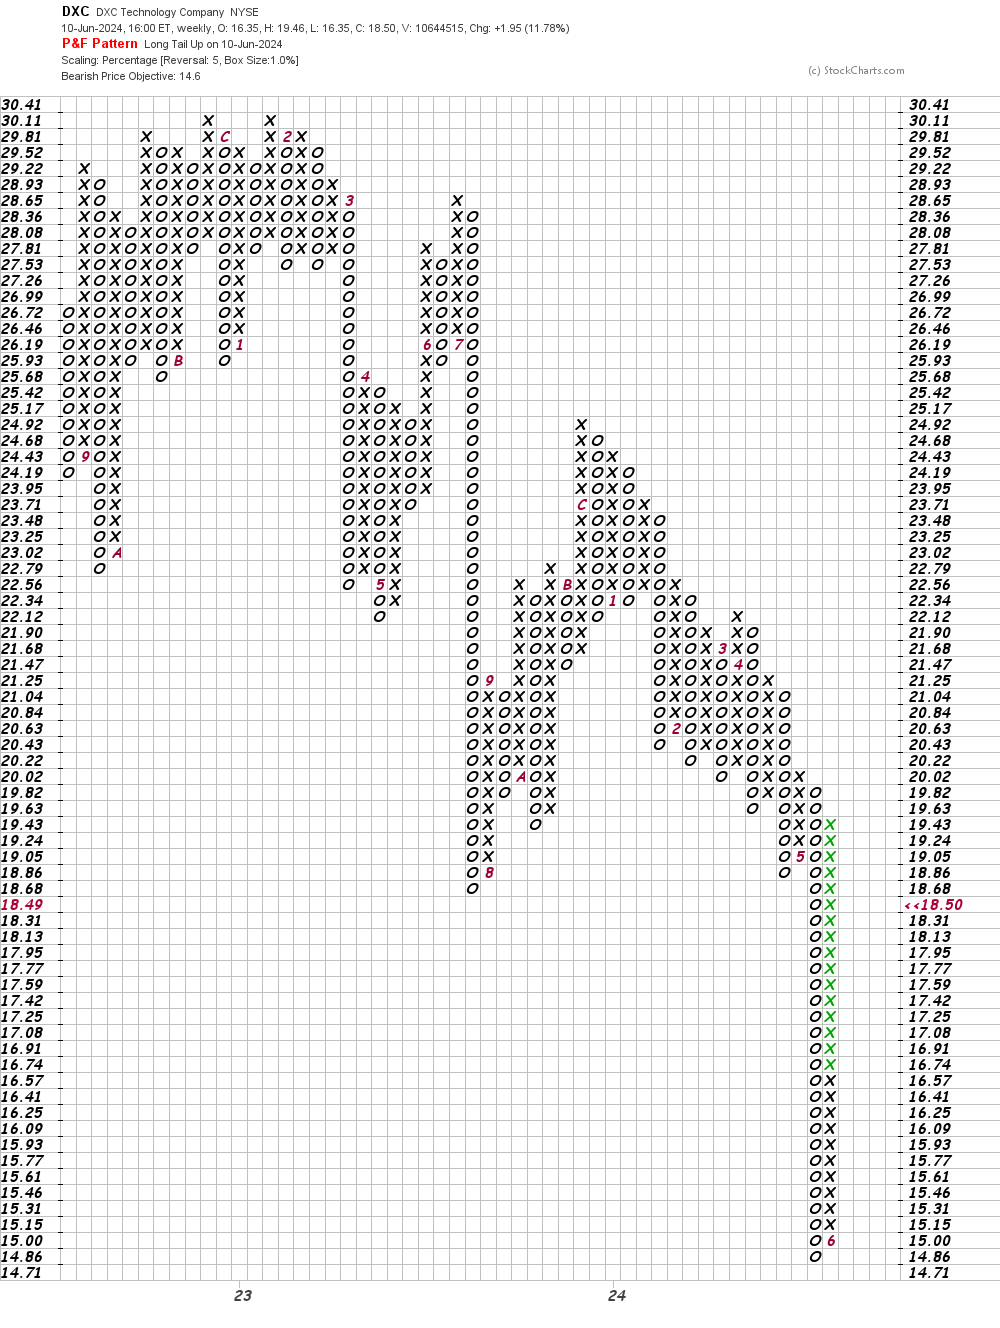
In this weekly Point and Figure chart of DXC, below, I used a five-box reversal filter. Here the software points to a downside price target in the $15-$14 area. Further declines are possible if a "deal" does not go through.
Bottom-line strategy: I have no special knowledge of any discussions between the parties mentioned above. The charts and indicators of DXC suggest we could see a deal for maybe $28 but again I have no idea of what may be going on in the boardrooms. Traders who may be long DXC should consider being a scale up seller towards $28, in my opinion. Stay nimble.
Employees of TheStreet are prohibited from trading individual securities.