Dutch Bros' Charts Have Gone Stale
Here's why this stock could drip and drip further down.
You've reached your free article limit
You've read 0 of 1 free Pro articles.
In my last review of Dutch Bros BROS on July 16, I recommended that "Traders who may be long BROS should raise sell stops to $37.90."
Let's get a cup of our favorite brew and check out the charts again, after this stock was added to the Portfolio.
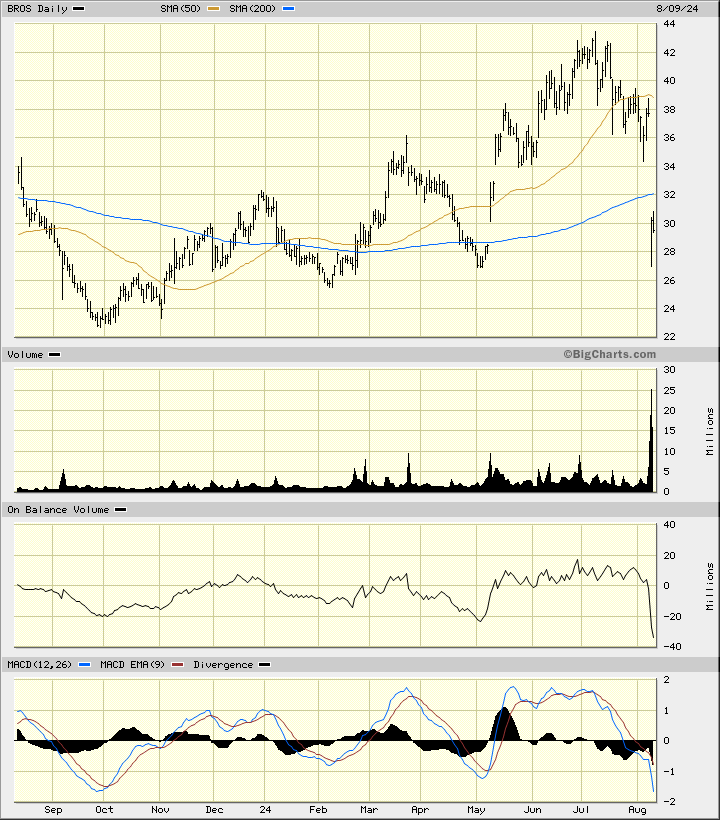
In this daily bar chart of BROS, I can see that traders should have stopped out back in the middle of July as prices broke below $37.90. With hindsight, we can see they avoided a lot of pain.
Prices gapped below the cresting 200-day moving average line and remain below the declining 50-day line. Prices filled a lot of old gaps and made a test of the May low. Prices went from hot to cold in a few weeks. The On-Balance-Volume (OBV) plunged in early August as sellers were more aggressive than buyers. The trend following Moving Average Convergence Divergence (MACD) oscillator is in a bearish alignment below the zero-line.
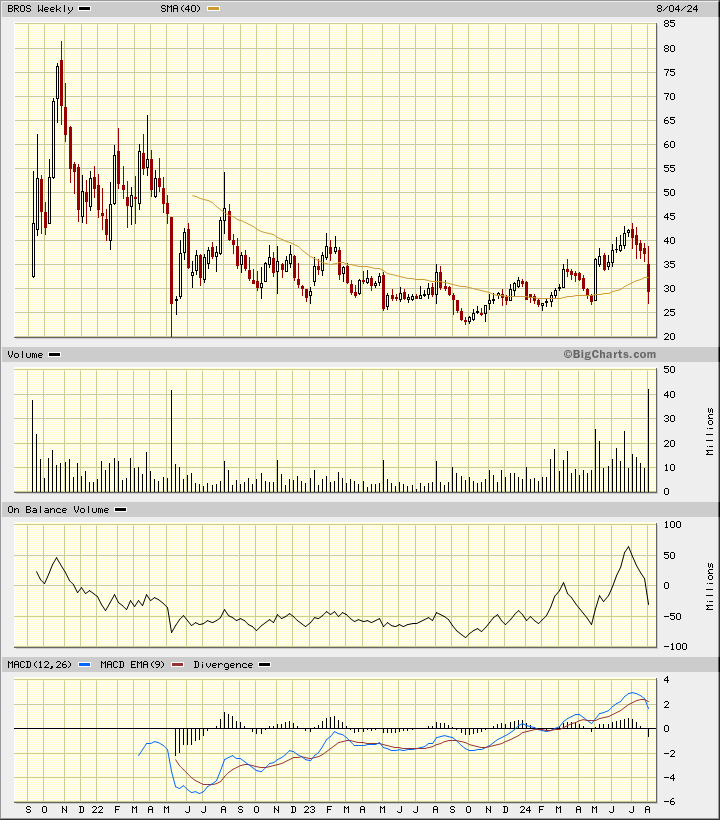
In this weekly Japanese candlestick chart of BROS, below, I can see that BROS made a base pattern until it made a sharp reversal to the downside. Prices broke below the 40-week moving average line. The weekly OBV line turned down sharply from late July showing us a quick change from aggressive buying to aggressive selling. The weekly Moving Average Convergence Divergence oscillator has crossed to the downside for a take-profit sell signal.
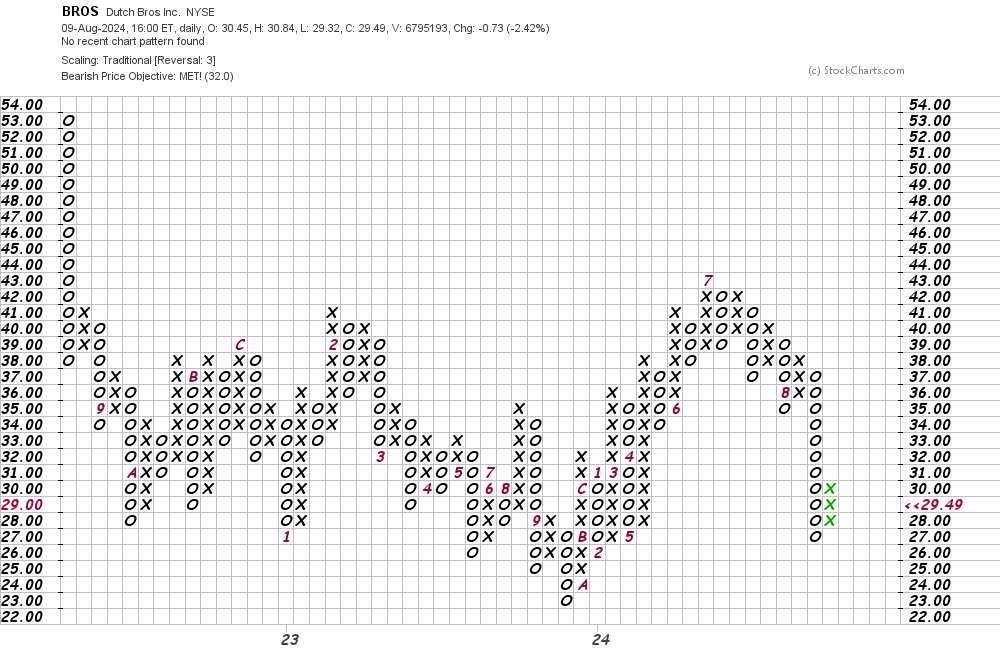
In this daily Point and Figure chart of BROS, below, I can see that prices reached and exceeded a downside price target in the $32 area.
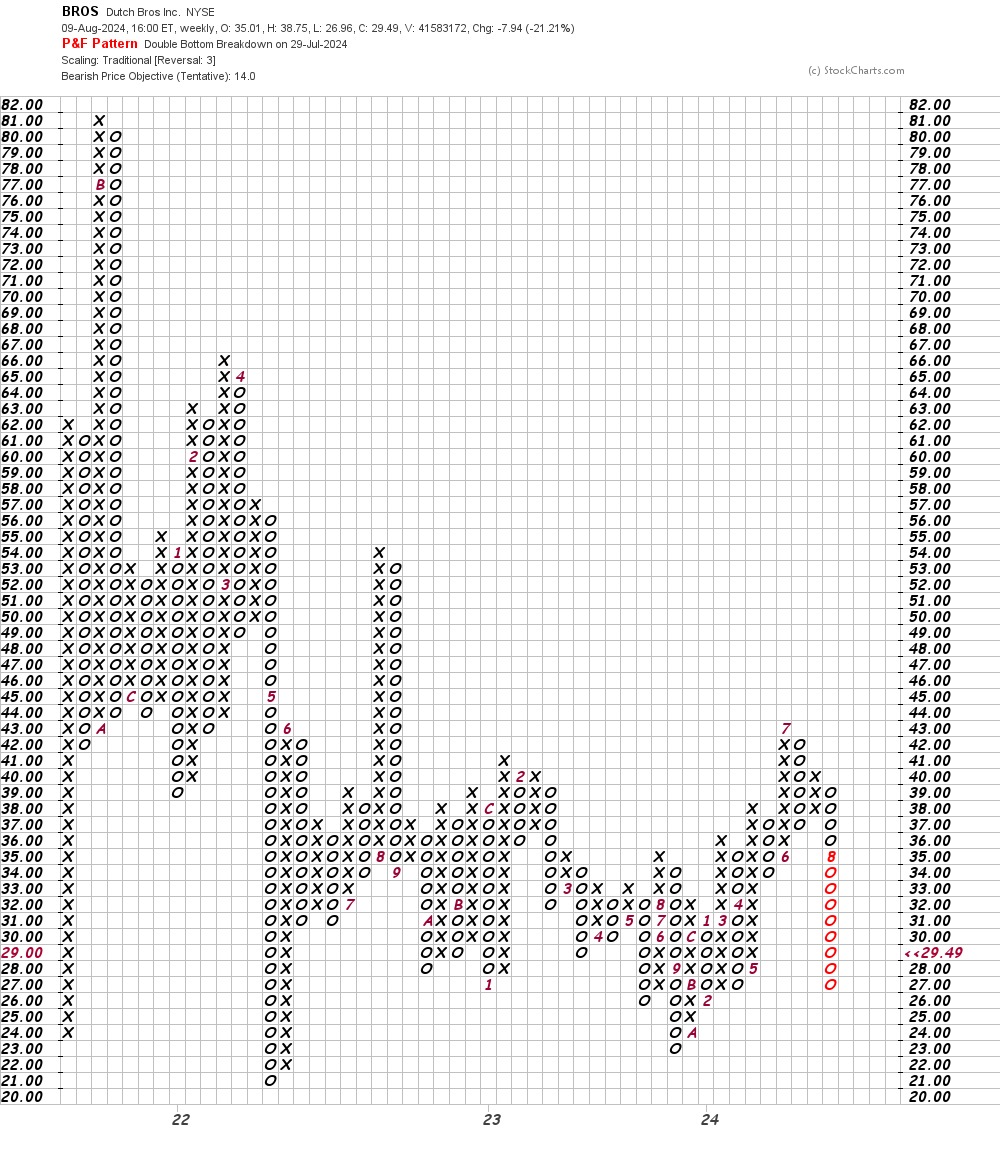
In this weekly Point and Figure chart of BROS, I can see a potential downside price target in the $14 area.
Bottom line strategy: I hope traders exited BROS before the steep slide. Stand aside for now as further declines are possible.
Employees of TheStreet are prohibited from trading individual securities.