Dutch Bros Is Brewing Potential Upside of 30% or More From Here
With shares of the rapidly expanding coffee chain showing bullish signs, here's how we'd play it.
You've reached your free article limit
You've read 0 of 1 free Pro articles.
Dutch Bros BROS is an Oregon-based chain of more than 800 drive-thru coffee shops located in 17 states. I have not visited a BROS location to see how it operates, but let's sit down and check out what might be brewing with the charts and indicators.
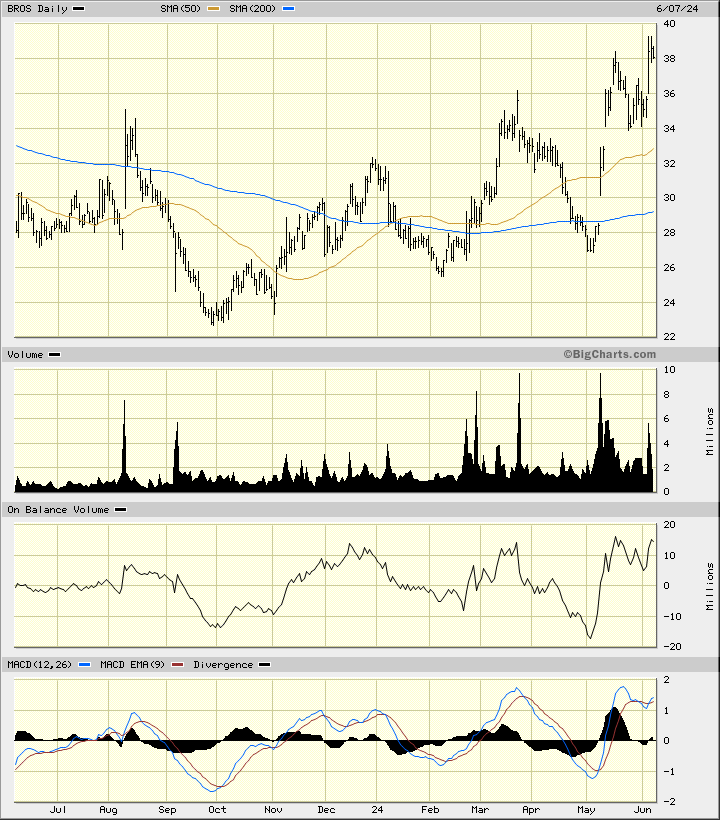
In the daily bar chart of BROS, below, I can see that the shares have chopped higher the past year. BROS trades above the rising 50-day moving average line and above the rising 200-day moving average line.
The trading volume has increased since late February. The On-Balance-Volume (OBV) line has moved up and down with the price action. The Moving Average Convergence Divergence (MACD) oscillator is above the zero line in bullish territory.
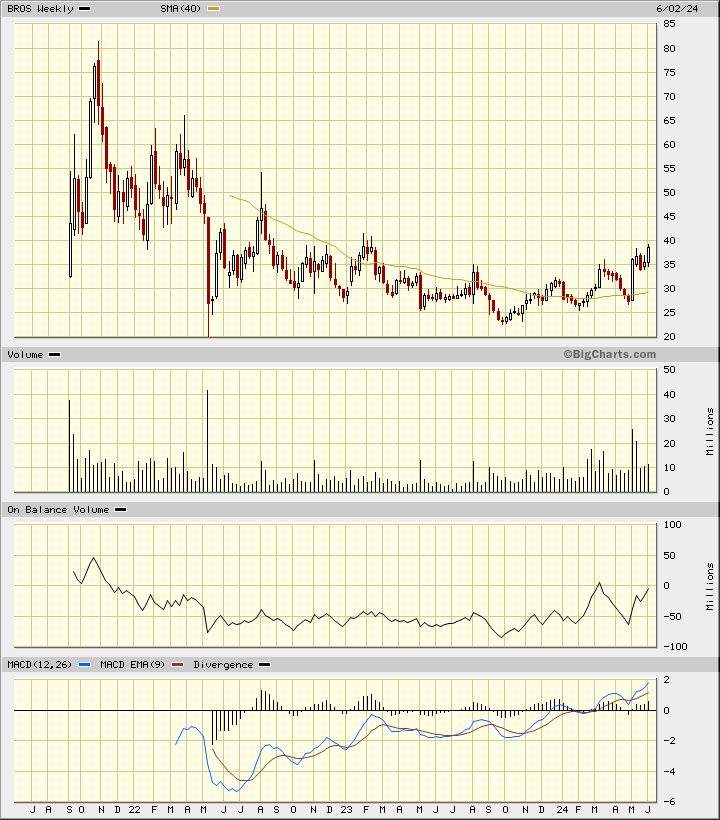
In the weekly Japanese candlestick chart of BROS, below, I can see a potential base pattern. The shares trade above the rising 40-week moving average line.
The weekly OBV line has been trying to work higher since September. The MACD oscillator is in a bullish alignment above the zero line.
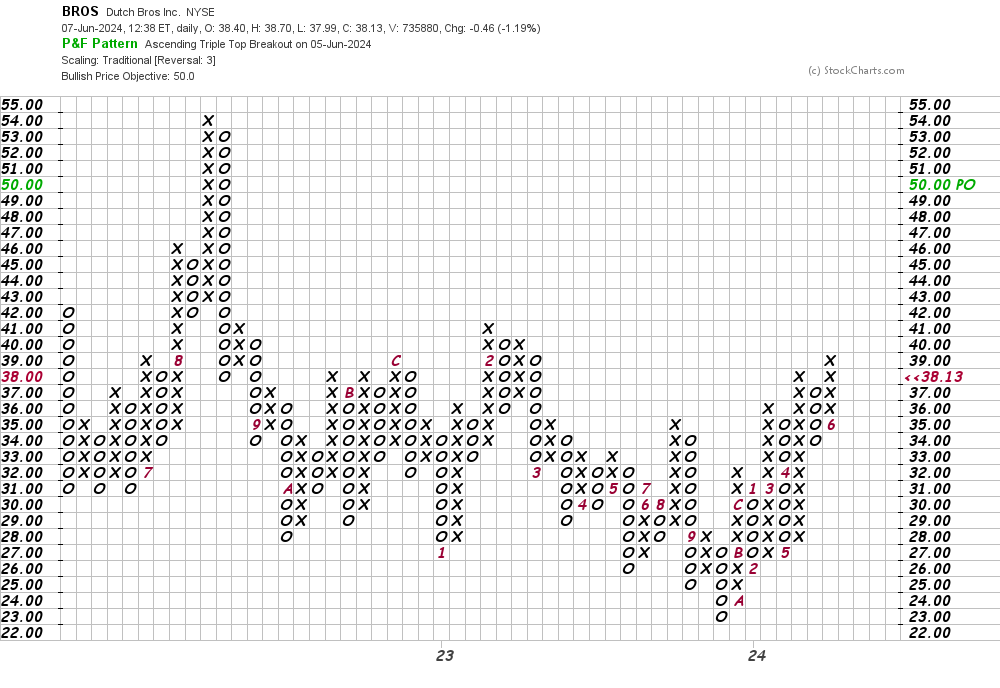
In this daily Point and Figure chart of BROS, below, I can see an upside price target in the $50 area.
In this weekly Point and Figure chart of BROS, below, I can see a price target in the $56 area.
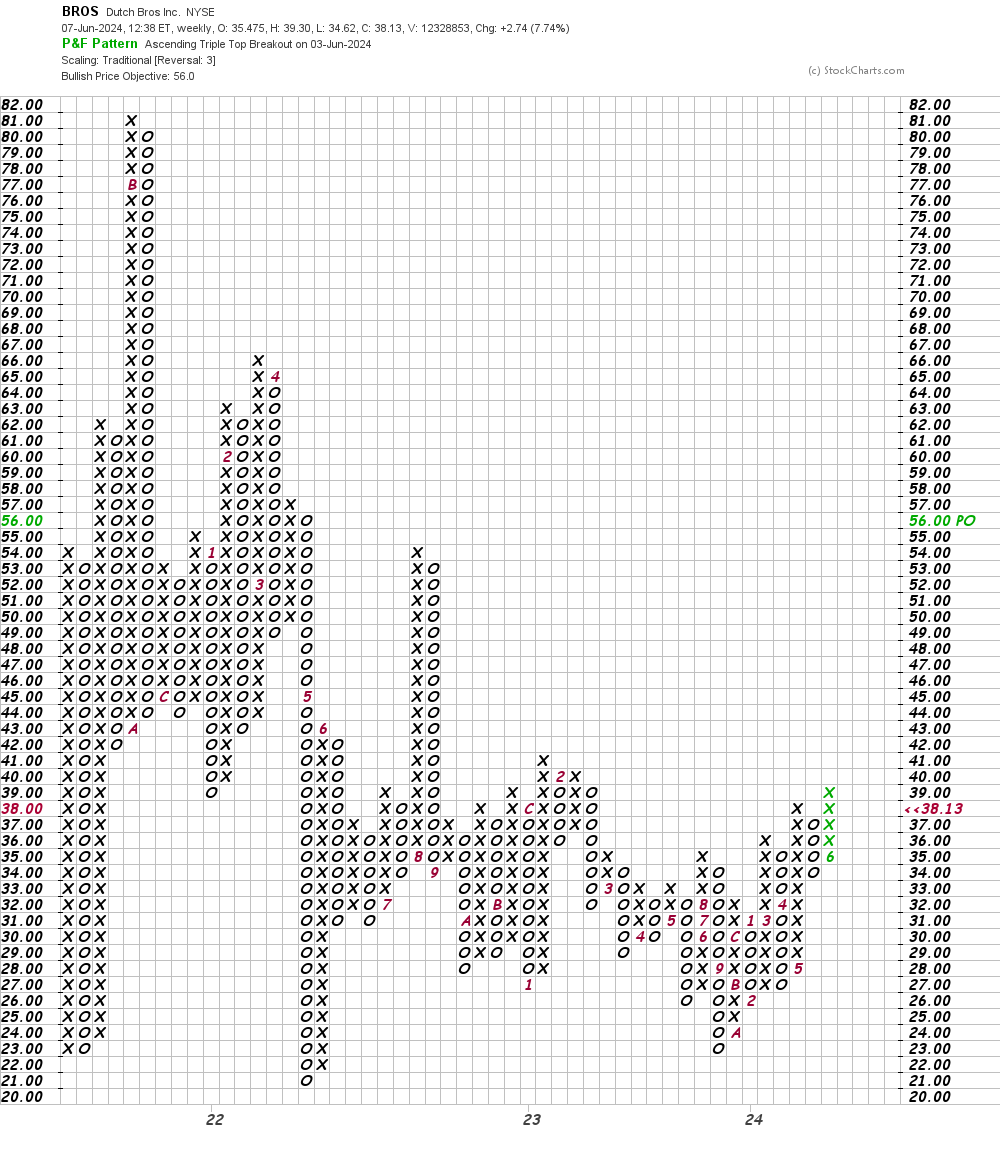
Bottom-line strategy: Traders could probe the long side of BROS in the $38-$37 area. Risk to $32. My price targets are $50 and $56.
Employees of TheStreet are prohibited from trading individual securities.