Don't Let Global Glitches Sway Your Microsoft Trade
As we chart this tech giant one thing is clear: Keep cool and pick your strategy now.
You've reached your free article limit
You've read 0 of 1 free Pro articles.
In my last review of Microsoft Corporation MSFT on May 21 I wrote that "There are always three things that can happen when you buy a stock - it can go up, down or sideways. Beneath the price action the indicators suggest the next move could be to the downside. Stocks don't have to listen to the indicators, so you need to be flexible and nimble."
And in my three-part Dow Jones series, I wrote on July 16 that "Microsoft has been a strong driver of gains for the DJIA in the past 12 months. MSFT trades above the rising 50-day average and the rising 200-day line. The OBV line has improved in recent months but has struggled to push clearly into new highs. The momentum study shows roughly equal highs in May and June, even though prices made higher highs. This is a bearish divergence and traders should watch this stock closer."
Everyone reading this Friday about the giant technical "glitch" overnight is wondering what this might do to the stock of MSFT.
Let's check the charts and indicators again.
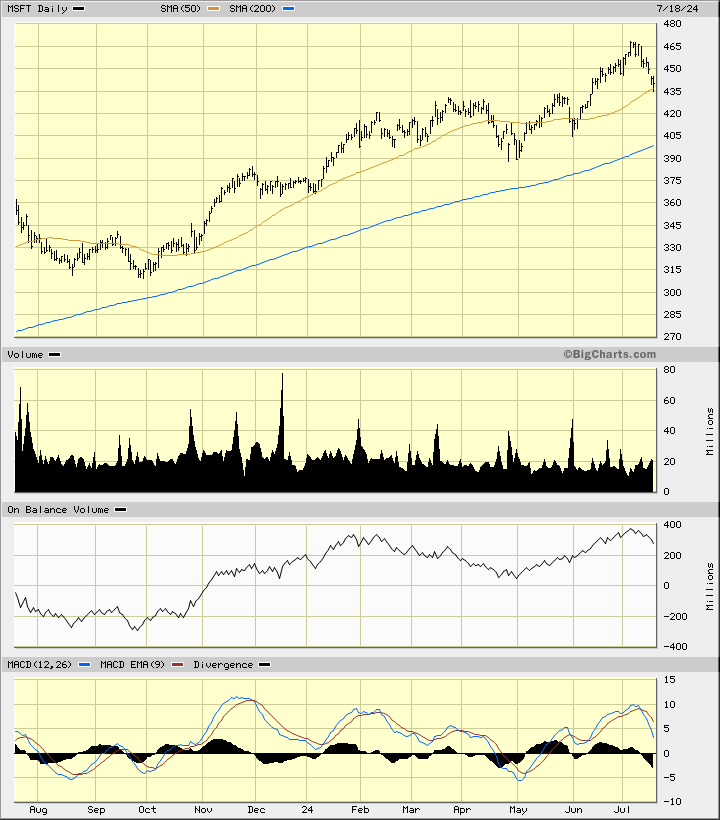
In this daily bar chart of MSFT, below, I can imagine that prices are trading slightly lower in early turnover. Prices are poised to test the rising 50-day moving average line. The trading volume in recent days does not show me anything out of the ordinary, but the daily On-Balance-Volume (OBV) line has edged lower in July. The trend-following Moving Average Convergence Divergence (MACD) oscillator is weakening and gives us a take-profits sell signal.
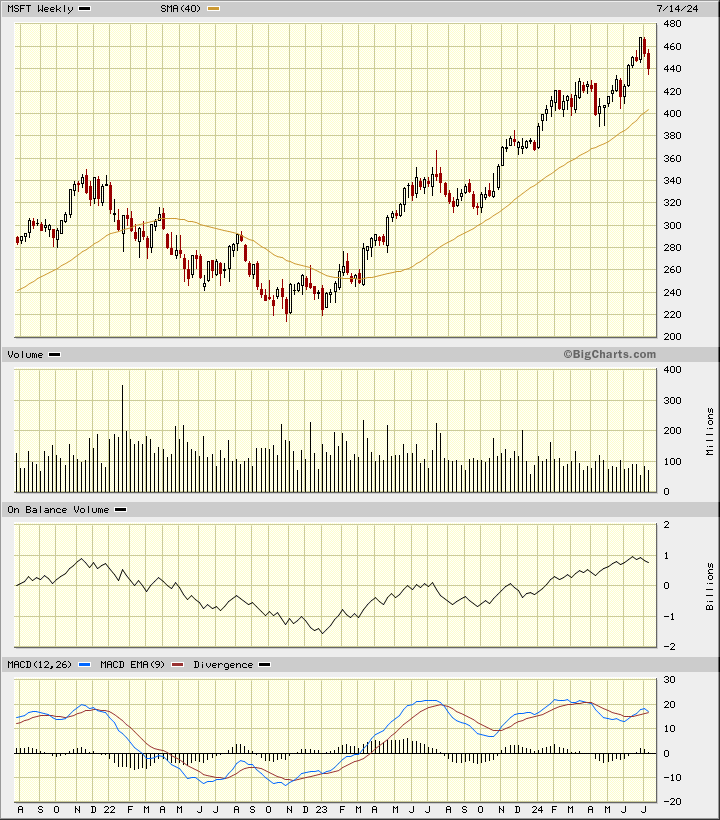
In this weekly Japanese candlestick chart of MSFT, below, I see a picture that has started to edge lower. Prices are poised to test potential chart support in the $423-$400 area. A trade at $415 or lower may mean that the entire support area may be broken. The weekly OBV line shows the start of some weakness in June. The MACD oscillator is poised for a downside crossover and take-profits sell signal.
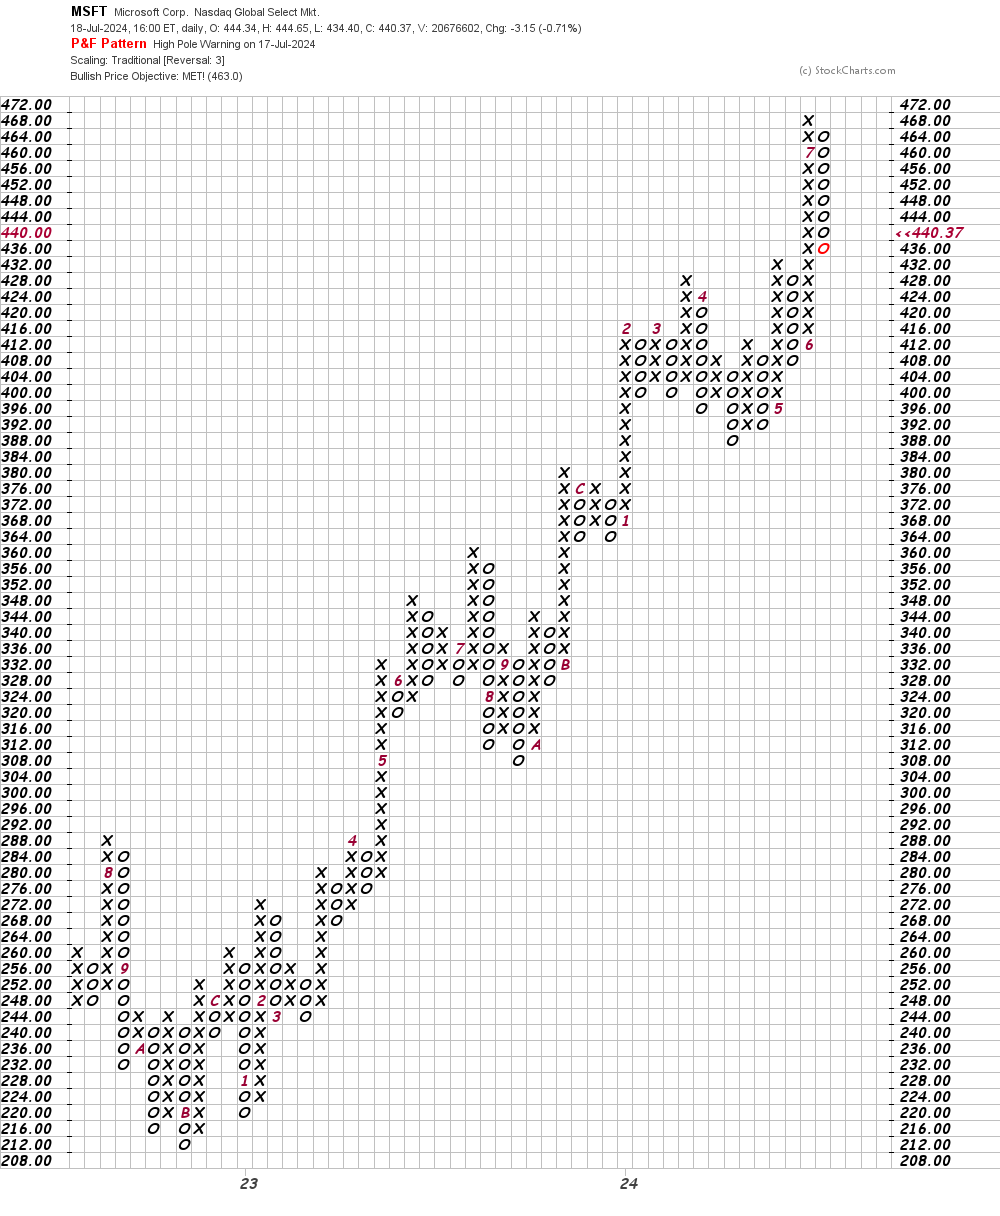
In this daily Point and Figure chart of MSFT, below, I can see that prices have reached and exceeded a price target in the $463 area.
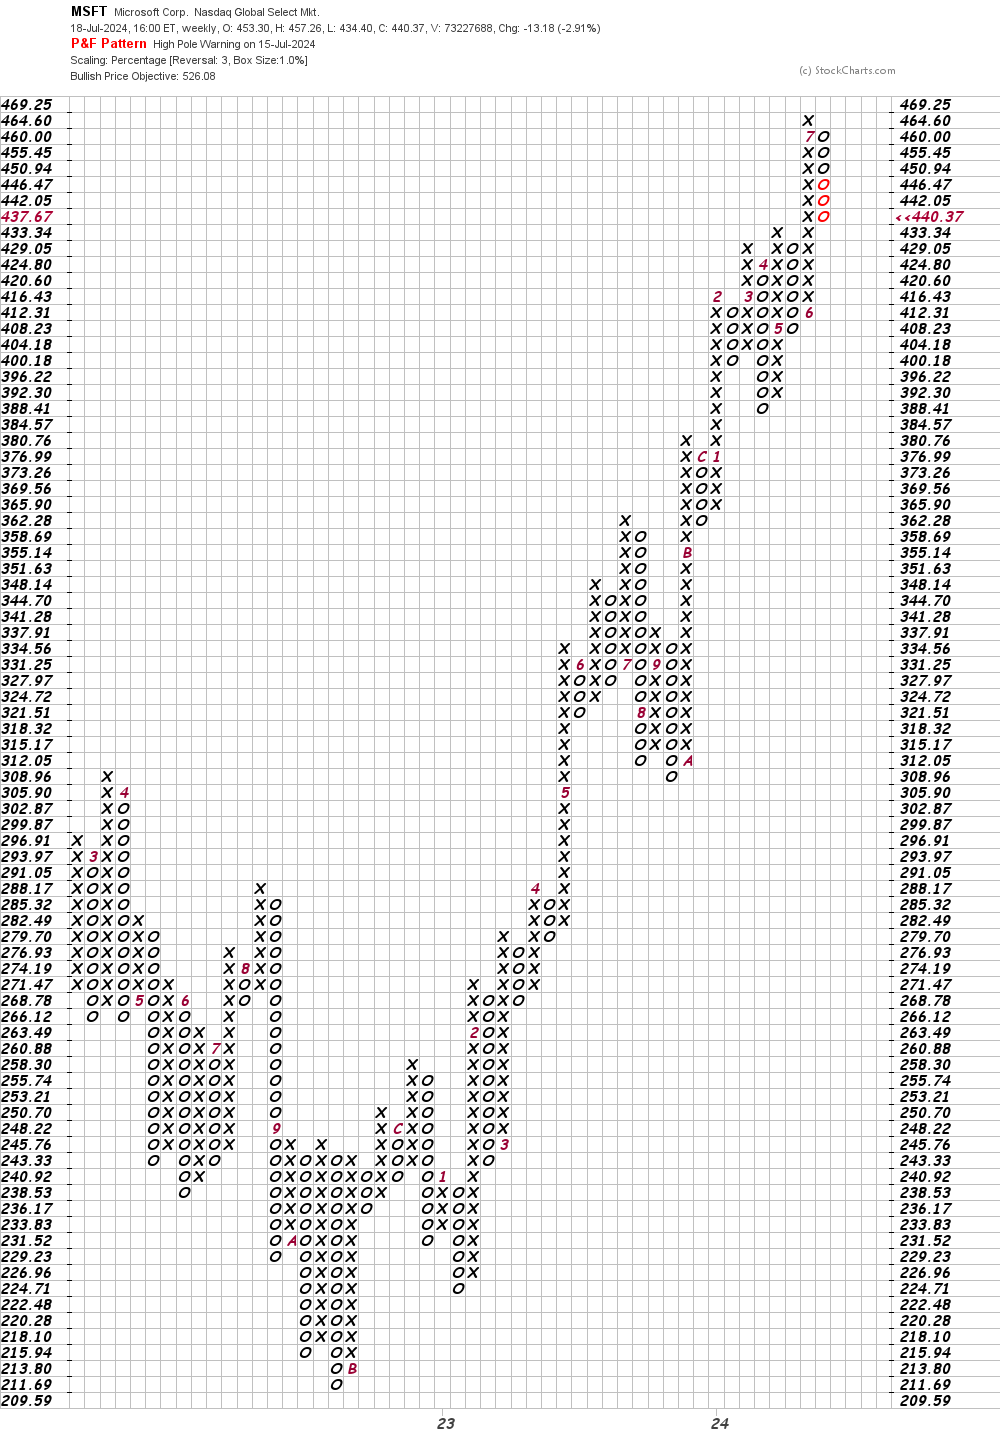
In this weekly Point and Figure chart of MSFT, below, I can see that the software still shows an upside price target. A trade at $408 or lower may be needed to turn this chart bearish.
Bottom line strategy: On the first night of every class on Technical Analysis that I taught at Baruch College I would go over with the students the various factors that can affect stock prices. From earnings and management to hopes and fears. Today is a day when fears will dominate and rational thinking may take a back seat.
Decide on a strategy ASAP that allows you to be calm and price levels you will respond to avoid what a fearful crowd might do.
Employees of TheStreet are prohibited from trading individual securities.