Are Microsoft's Charts Showing a Topping Pattern or Bullish Consolidation?
Stocks don't have to listen to the indicators, so you need to be flexible and nimble.
You've reached your free article limit
You've read 0 of 1 free Pro articles.
Microsoft MSFT is without a doubt a market leader. It is widely held by institutions and index funds. Some seasoned market observers are concerned about the concentration of ownership of MSFT and another leader - Nvidia NVDA. Any misstep or disappointment could produce significant selling is their concern, and while this might seem like the boy who cried wolf we shouldn't just dismiss this situation.
Let's check out the charts and indicators of MSFT.
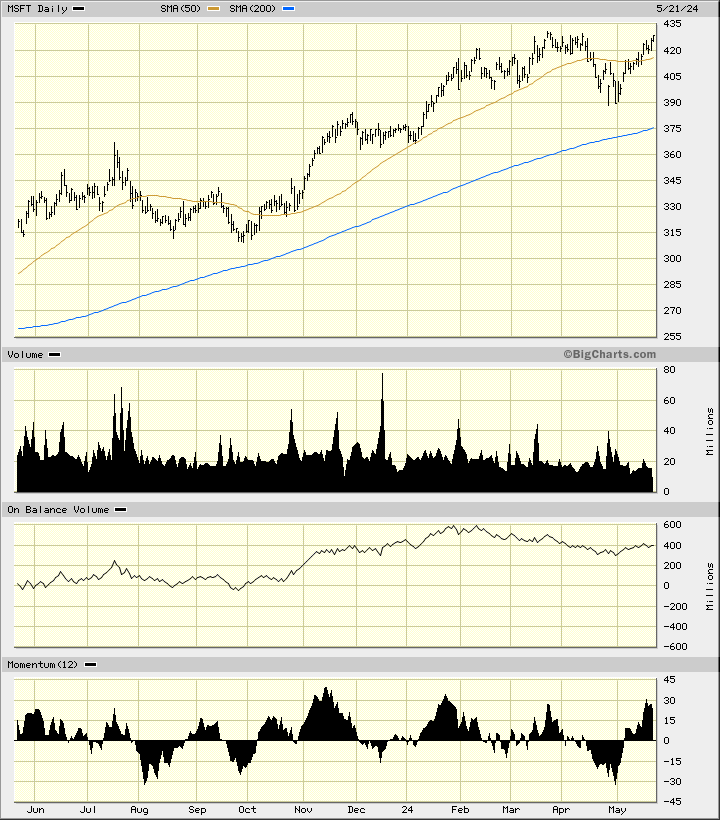
In this daily bar chart of MSFT, below, I can see that prices have traded higher since late September. Prices are trading above the rising 50-day moving average line and above the rising 200-day moving average line. The trading volume has been more active since late October.
The On-Balance-Volume (OBV) line shows a rise into early February followed by a gentle decline into late April. The 12-day price momentum study in the lower panel shows us a pattern of lower highs from November. Prices have been making higher highs but with this indicator making lower highs we have a bearish divergence which could be foreshadowing a move to the downside.
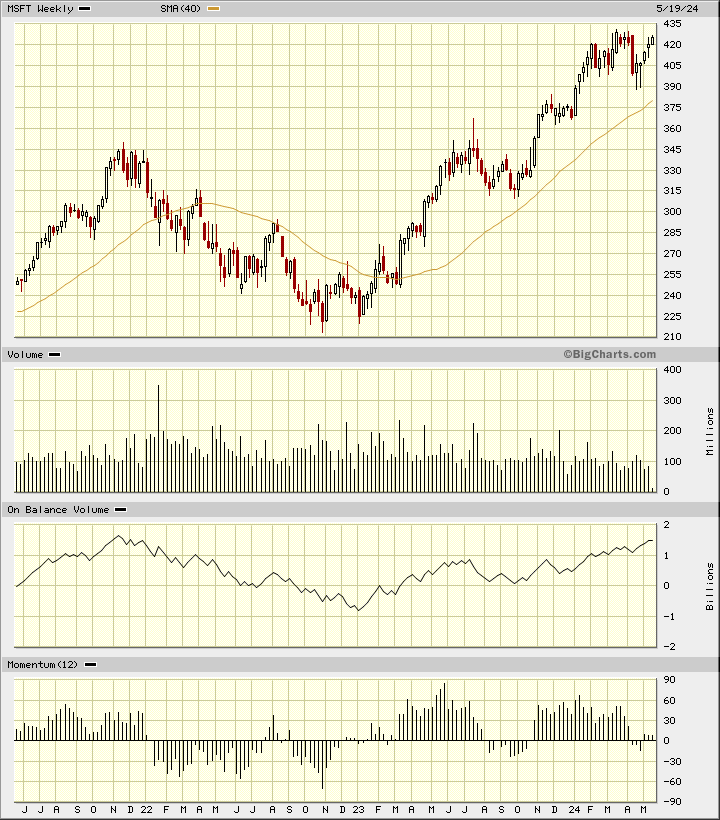
In this weekly Japanese candlestick chart of MSFT, below, I can see a pattern similar to the daily chart above. Prices have made a strong rally over the past two years. Prices are trading above the rising 40-week moving average line. Trading volume has been flat during the rally and I do not see it as a positive.
The weekly OBV line shows an advance but that could reverse direction soon. The 12-week momentum study shows lower highs since May of 2023. This is a longer-term bearish divergence.
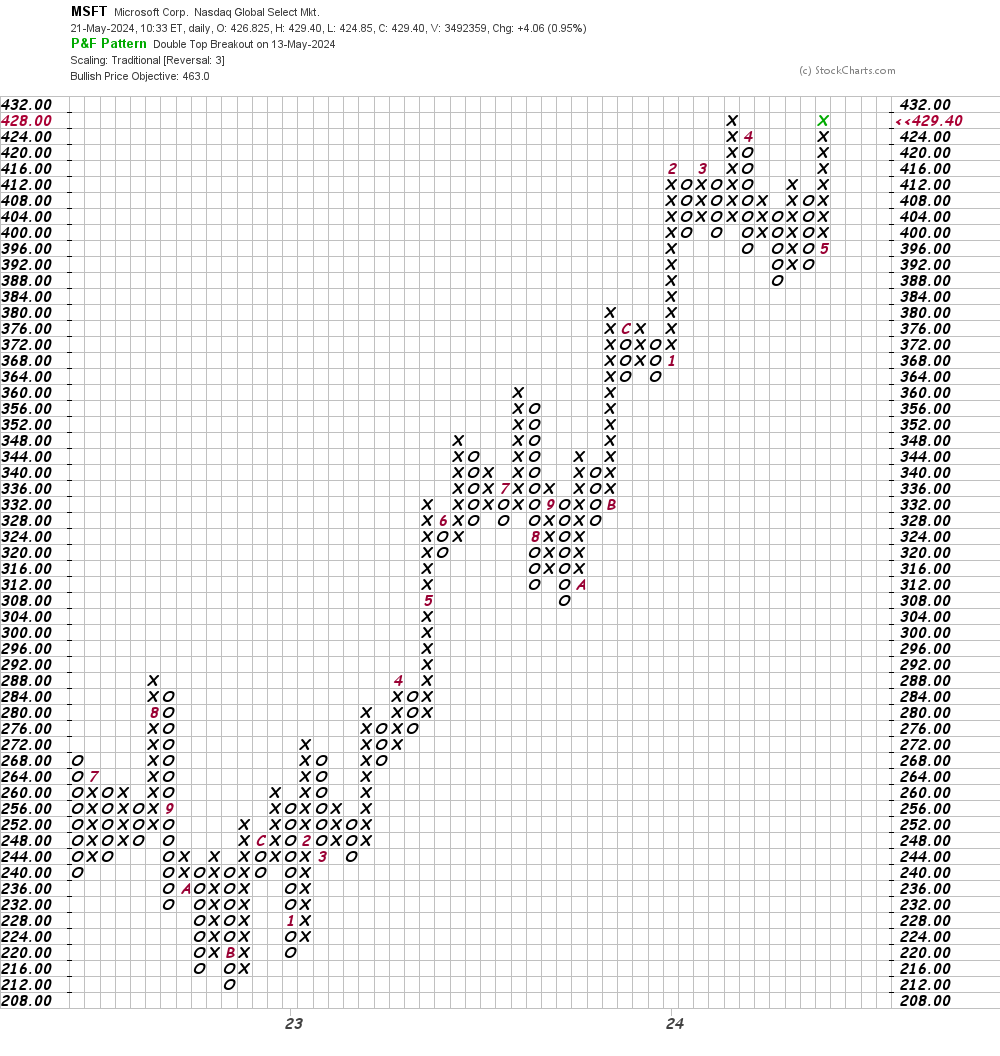
In this daily Point and Figure chart of MSFT, below, I can see that the software is projecting a price target in the $463 area. A trade at $432 looks like a potential breakout level.
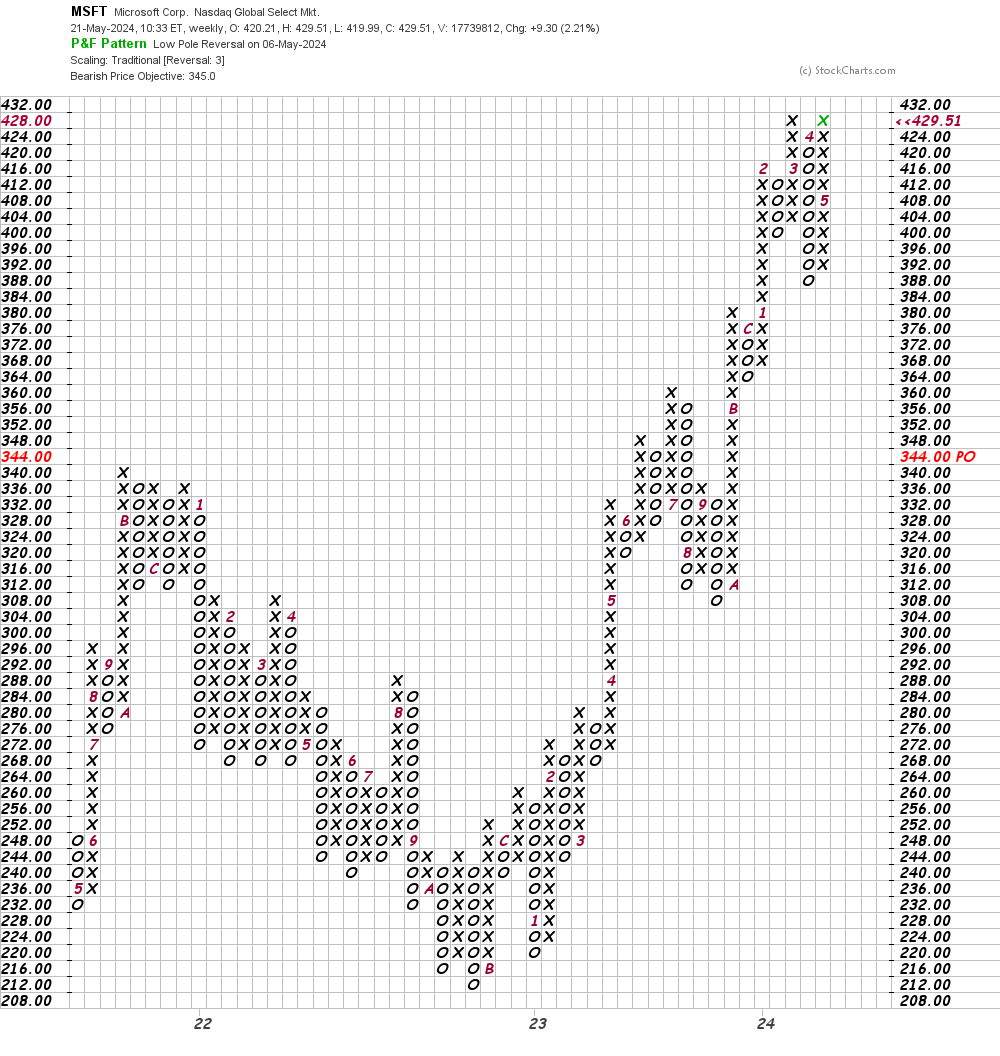
In this weekly Point and Figure chart of MSFT, below, I can see a potential downside price target in the $345 area.
Bottom line strategy: There are always three things that can happen when you buy a stock - it can go up, down or sideways. Beneath the price action the indicators suggest the next move could be to the downside. Stocks don't have to listen to the indicators, so you need to be flexible and nimble.
Employees of TheStreet are prohibited from trading individual securities.