Don't Get Too Hyped Up About Amazon Ahead of Earnings
Let's see what the charts and indicators look like.
You've reached your free article limit
You've read 0 of 1 free Pro articles.
Online retail giant Amazon AMZN is slated to report their latest quarterly figures after the close of trading Tuesday. Let's check out the charts and indicators.
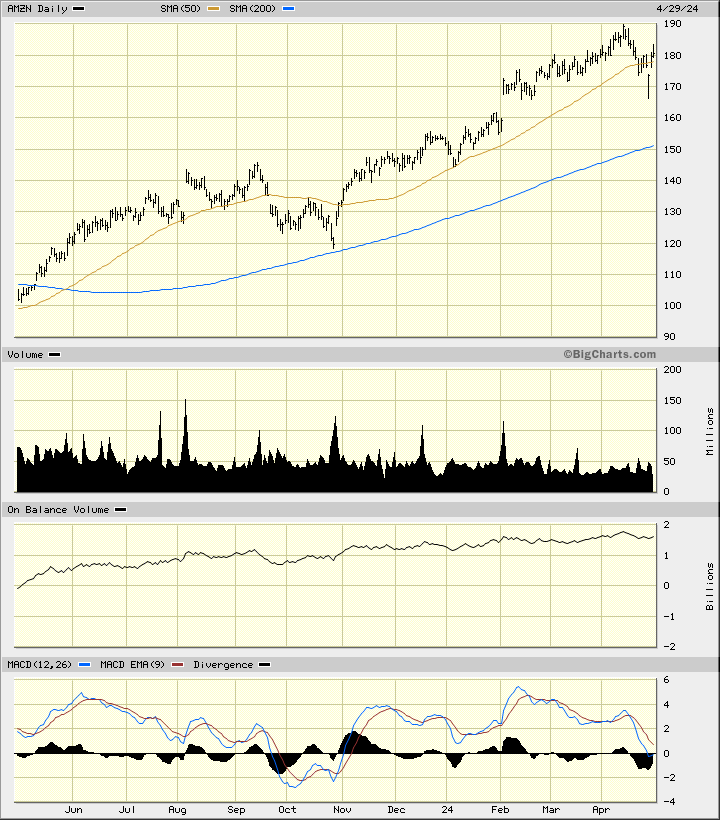
In this daily bar chart of AMZN, below, I can see that prices have not quite doubled in the past twelve months. AMZN recently broke below the rising 50-day moving average line and has rallied back above it. Prices are firmly above the rising 200-day moving average line which intersects down around $151.
The On-Balance-Volume (OBV) line has softened in April and tells me that buyers of AMZN are not as aggressive as they were a few months ago. The Moving Average Convergence Divergence (MACD) oscillator is only slightly above the zero line.
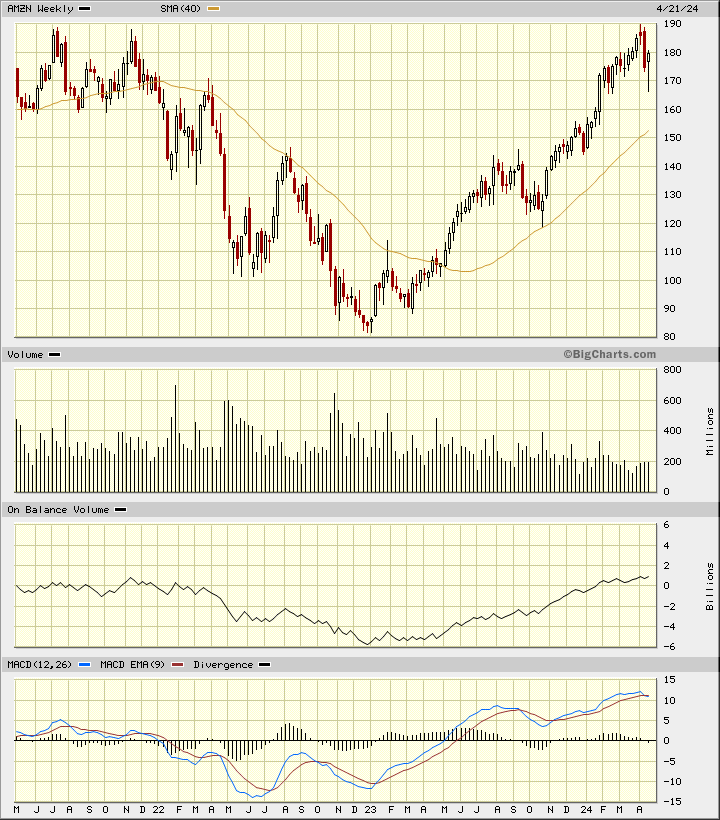
In this weekly Japanese candlestick chart of AMZN, below, I see a mixed picture. Prices are in a longer-term uptrend and trade above the rising 40-week moving average line. The most recent candle pattern has a large lower shadow telling me that traders rejected the lows but the candles in March and early April show us a top reversal. The trading volume has been weakening in recent weeks.
The OBV line strengthened in 2023 but has started to level off in 2024. The MACD oscillator is above the zero line but has narrowed and is close to a downside crossover and potential take profits sell signal.
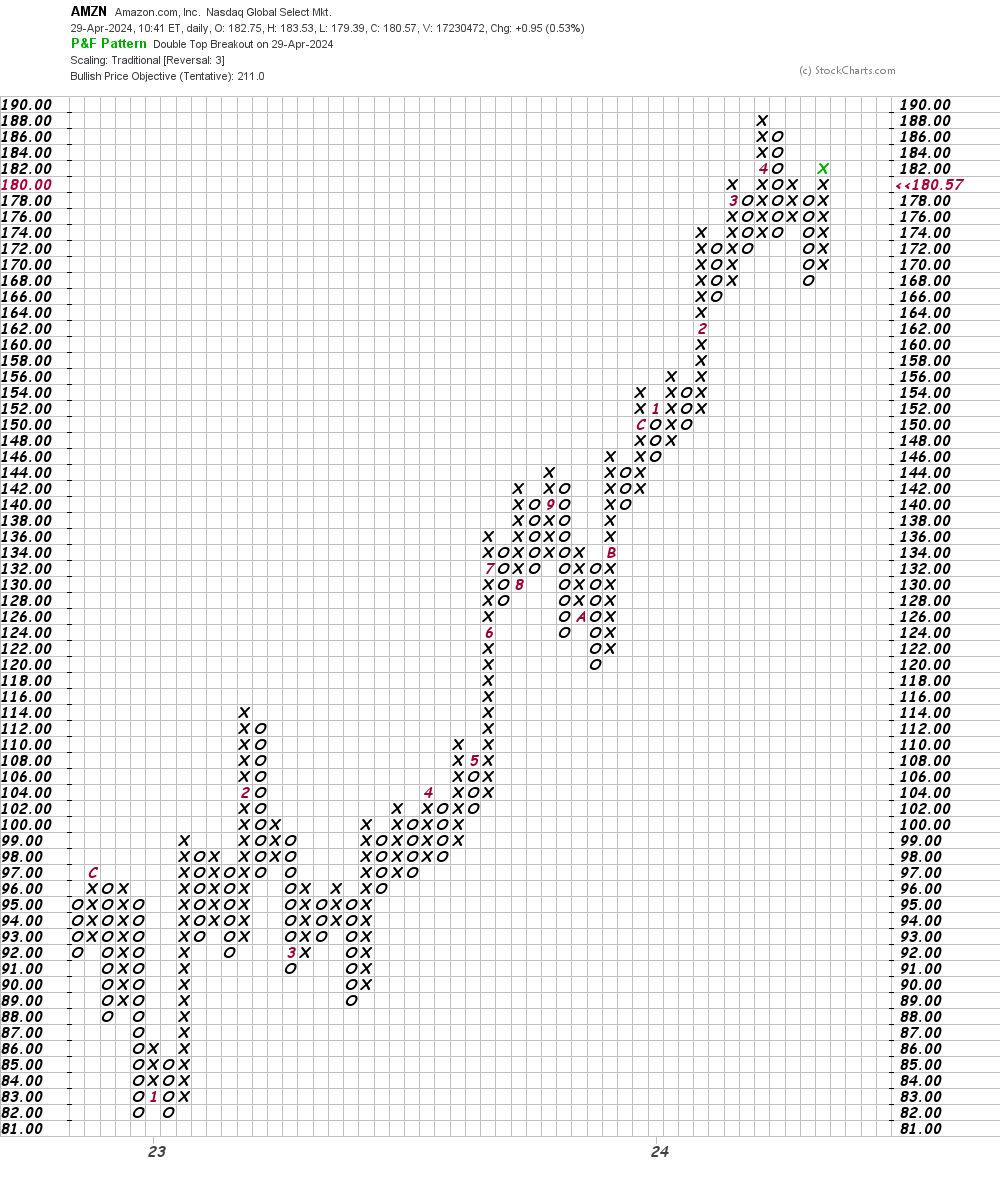
In this daily Point and Figure chart of AMZN, below, I can see a potential upside price target in the $211 area.
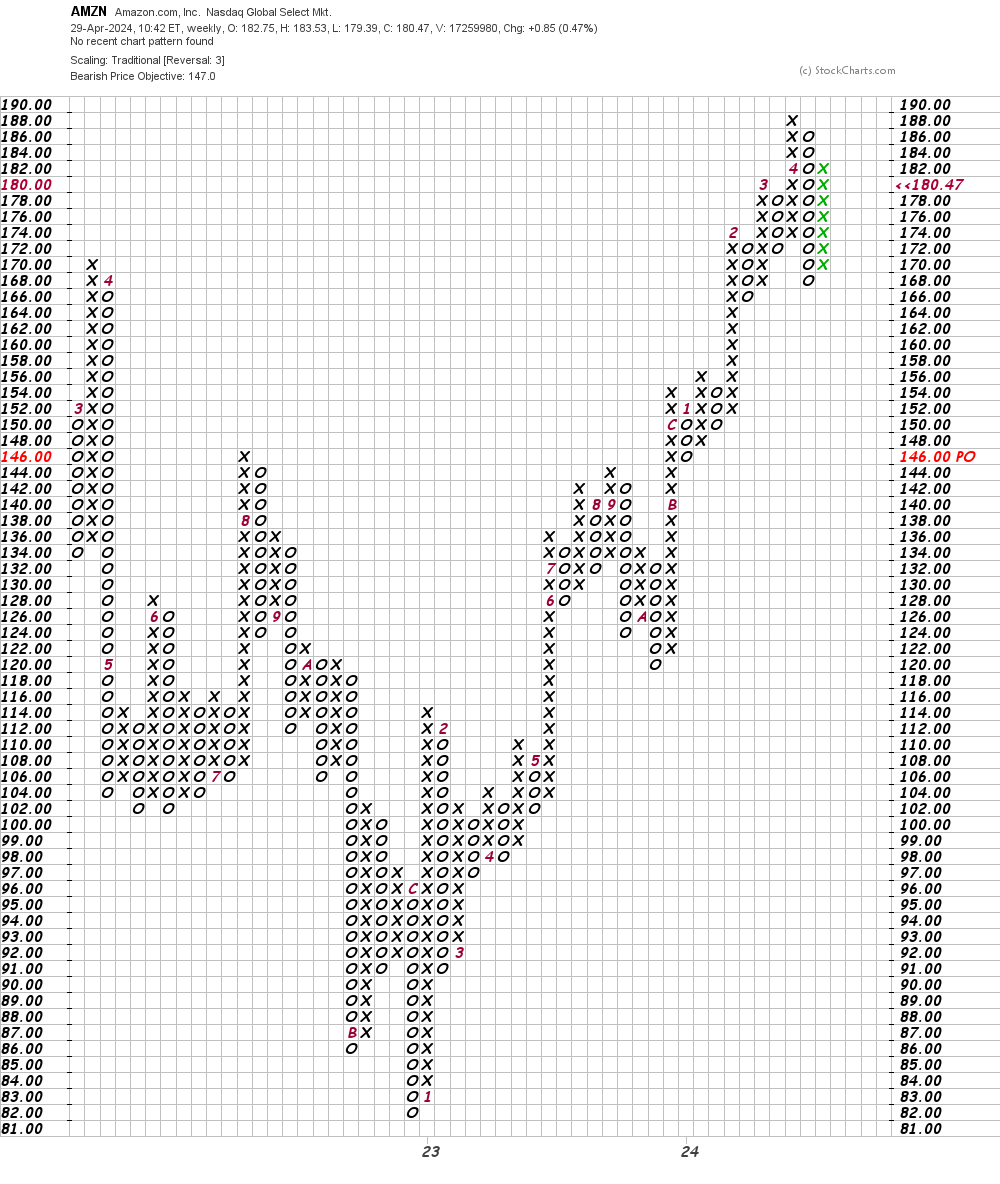
In this weekly Point and Figure chart of AMZN, below, I can see a downside price target in the $147 area.
Bottom line strategy: I have no special knowledge of what AMZN will tell shareholders Tuesday night, but the charts suggest we could see prices go in either direction - up or down. My unscientific "gut" feels that there are too many overly optimistic analysts out there... just saying.
Employees of TheStreet are prohibited from trading individual securities.