Disney Downtrend Likely to Continue
The entertainment giant is enjoying a nice box office return from its latest film but the stock charts show clear risk of further losses.
You've reached your free article limit
You've read 0 of 1 free Pro articles.
The Walt Disney Co. DIS has been raking in the dollars as "Deadpool & Wolverine" surpasses $1 billion in worldwide ticket sales, but it has not stopped the downtrend on the charts.
Let's check out the latest charts and indicators for an update.
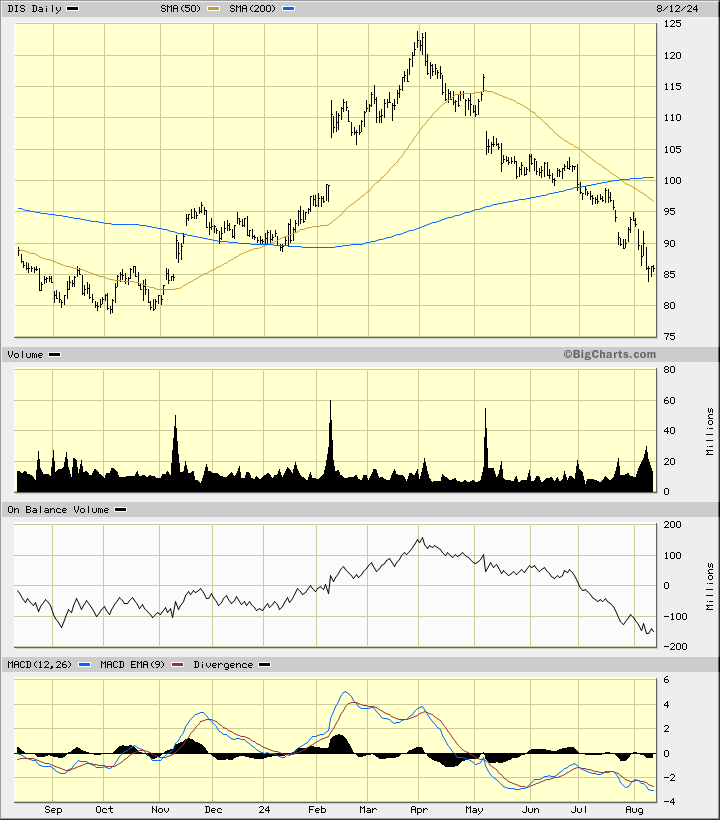
In this daily bar chart of DIS below, I can see that prices have entered their fifth month of weakness. Prices trade below the declining 50-day moving average line and below the cresting 200-day moving average line. The On-Balance-Volume (OBV) line has been in a decline since early April as traders have been more aggressive sellers than buyers. The Moving Average Convergence Divergence (MACD) oscillator has been below the zero since late April.
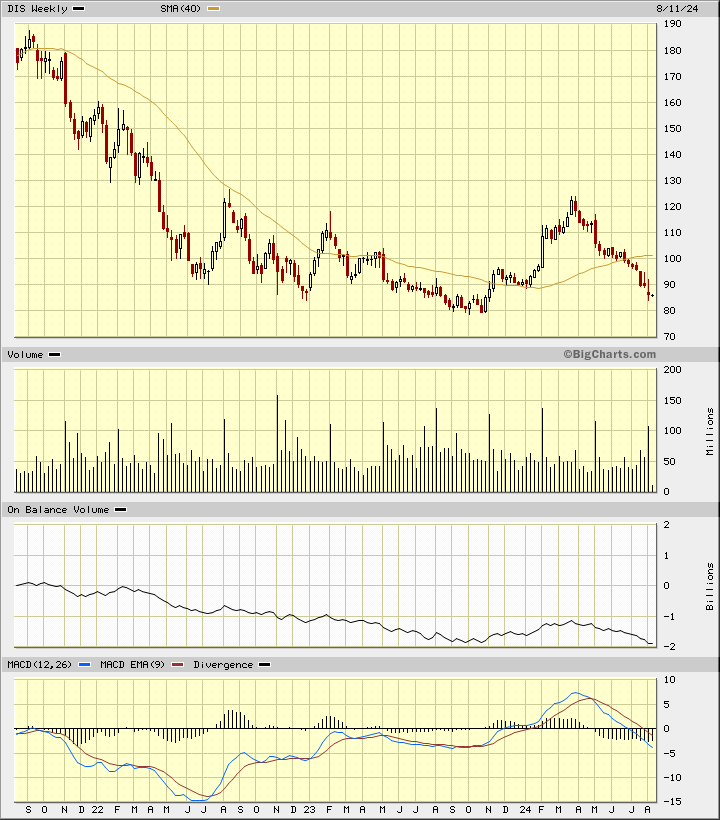
In this weekly Japanese candlestick chart of DIS below, I see a weakening picture or setup. Prices are trading below the weakening 40-week moving average line. The candles have yet to show us a bottom reversal pattern. The weekly OBV line is making a new low or is close to a new low for the move down. The MACD oscillator has moved below the zero line for an outright sell signal.
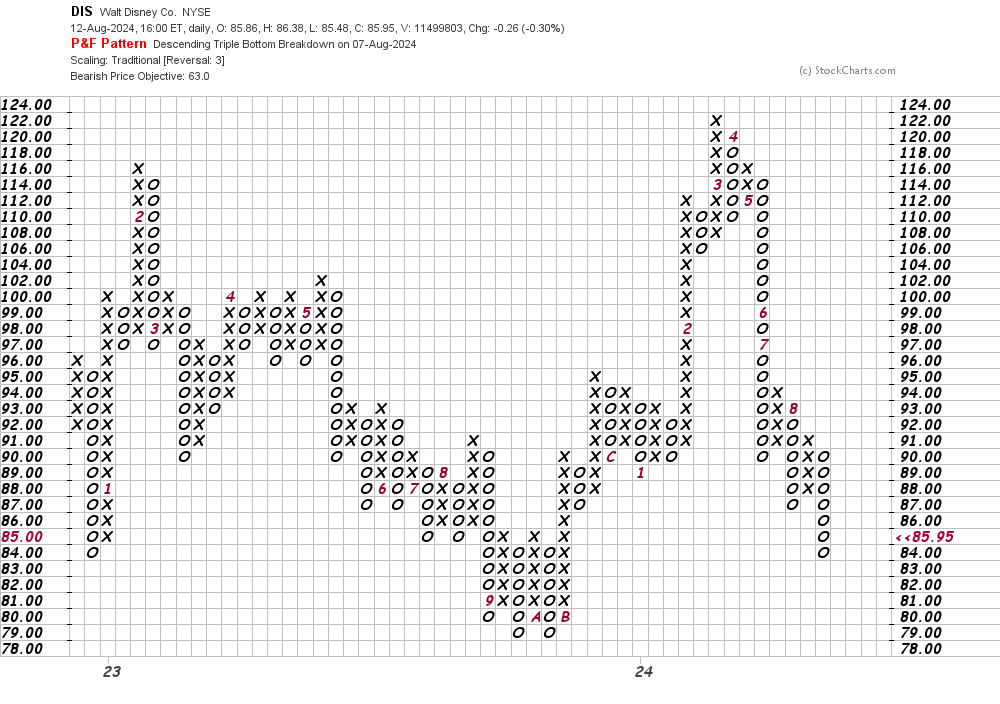
In this daily Point and Figure chart of DIS below, I can see a potential downside price target in the $63 area.
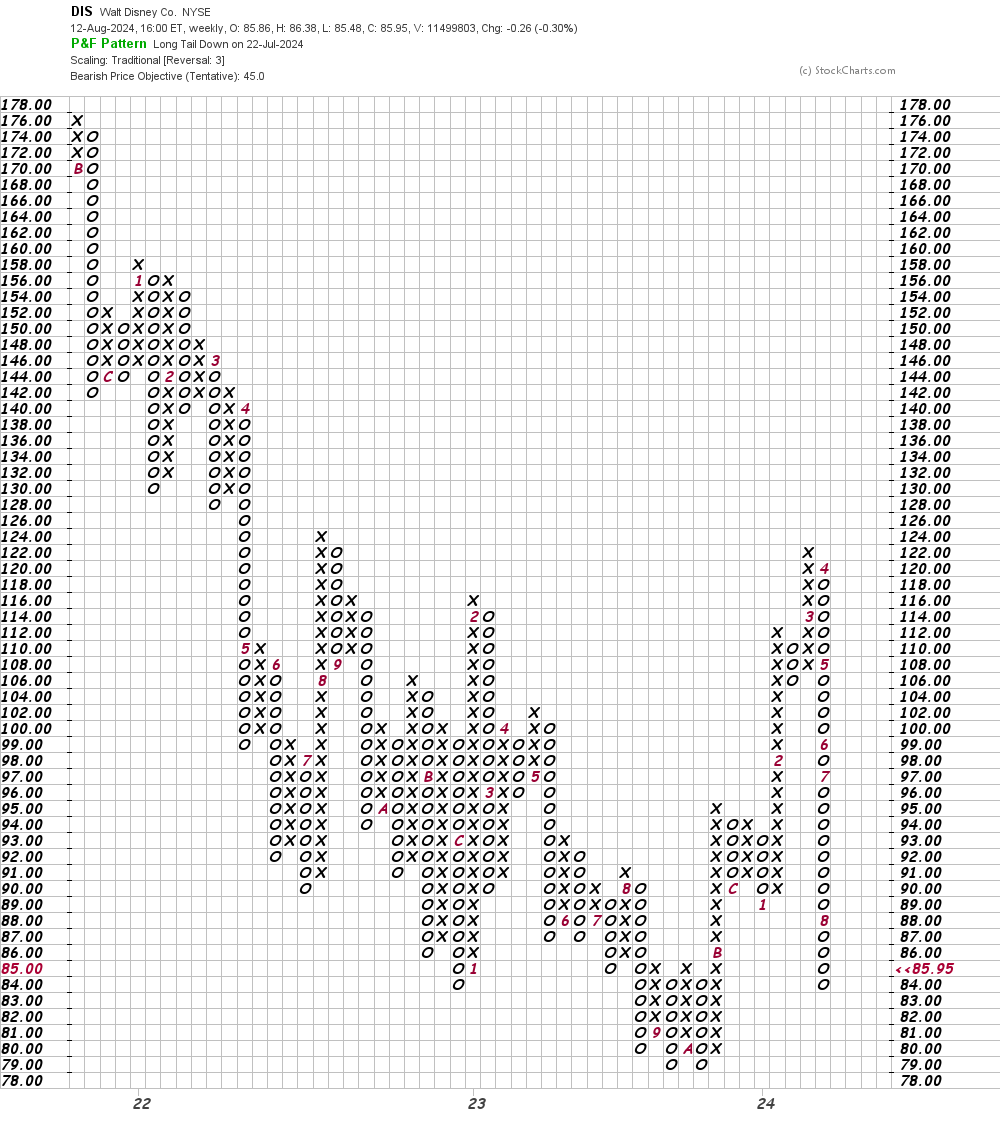
In this weekly Point and Figure chart of DIS below, I can see a downside price target in the $45 area.
Bottom line strategy: DIS could make an oversold bounce at any time but the trend is down and further declines is the risk going forward.
Employees of TheStreet are prohibited from trading individual securities.