CVS Gets Hit With One-Two Punch, But Could Be Ready to Fight Back
The stock has made a long round trip from bullish to bearish.
You've reached your free article limit
You've read 0 of 1 free Pro articles.
CVS Health CVS disappointed shareholders Wednesday with a first-quarter earnings miss and poor guidance. If that was not enough, the stock saw downgrades by sell-side analysts on Wednesday as well as Thursday.
Let's check the pulse and temperature of CVS shares.
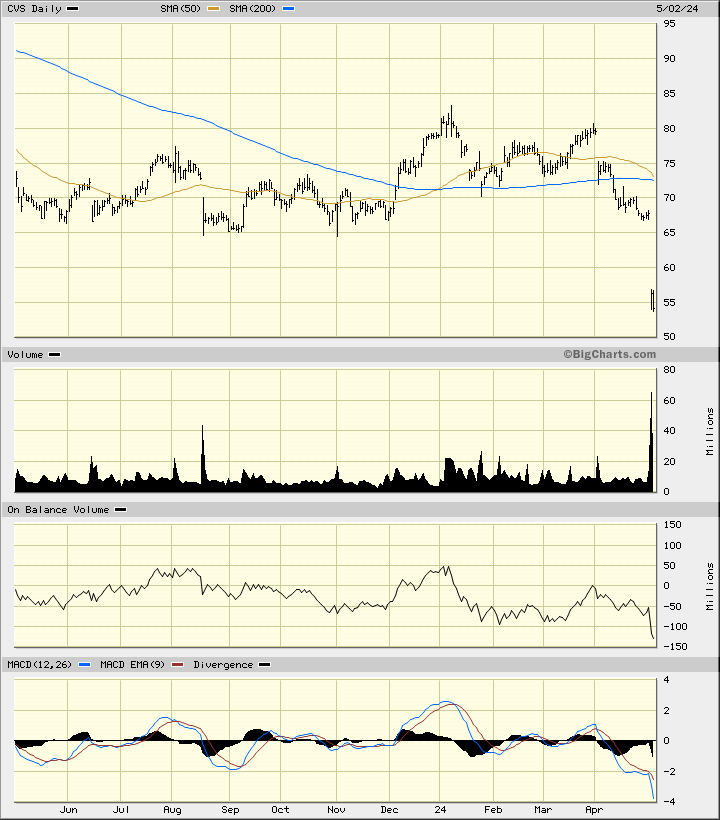
In the daily bar chart of CVS, below, I can see that the shares have gapped sharply lower and have continued to slump on Thursday. Support in the $65 area was smashed and it is going to represent a zone of resistance on any bounce higher. CVS trades below the declining 50-day moving average line and below the declining 200-day line.
The On-Balance-Volume (OBV) line has been weak since the beginning of 2024 and tells me that sellers of CVS are being more aggressive than buyers. The Moving Average Convergence Divergence (MACD) oscillator is in a bearish alignment below the zero line.
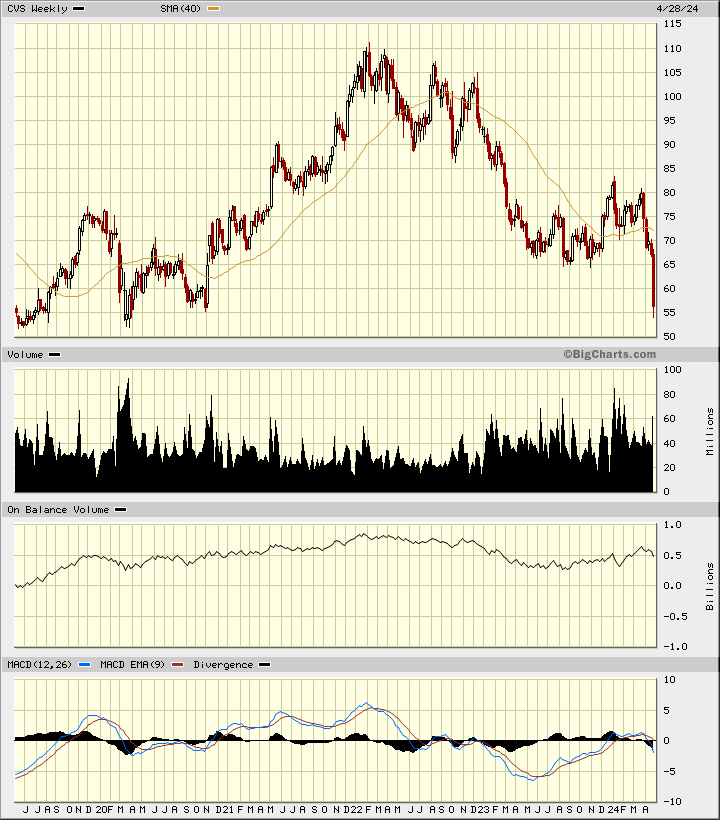
In the weekly Japanese candlestick chart of CVS, below, I can see a stock that has made a long round trip from bullish to bearish. The shares have been cut by more than half and trade below the declining 40-week moving average line.
Trading volume has been heavy. The weekly OBV line shows a decline from early 2022. The MACD oscillator has rolled over above the zero line and is close to a new sell signal.
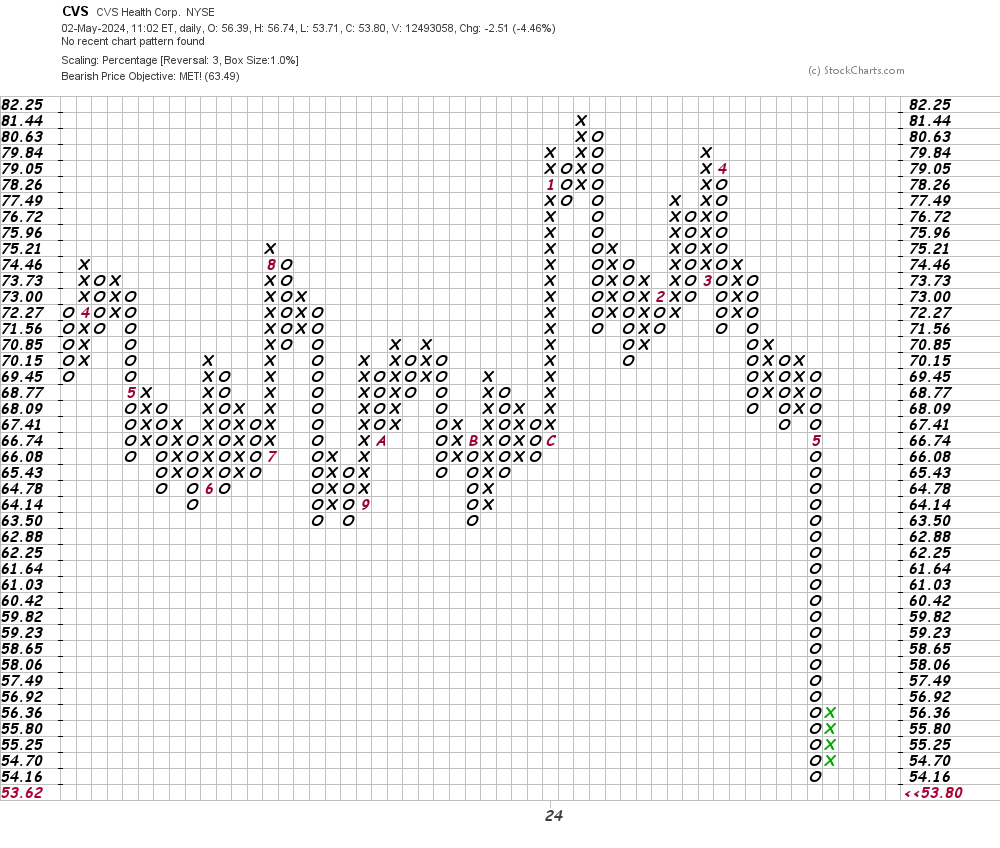
In this daily Point and Figure chart of CVS, below, I can see that the shares reached and exceeded a price target in the $63 area.
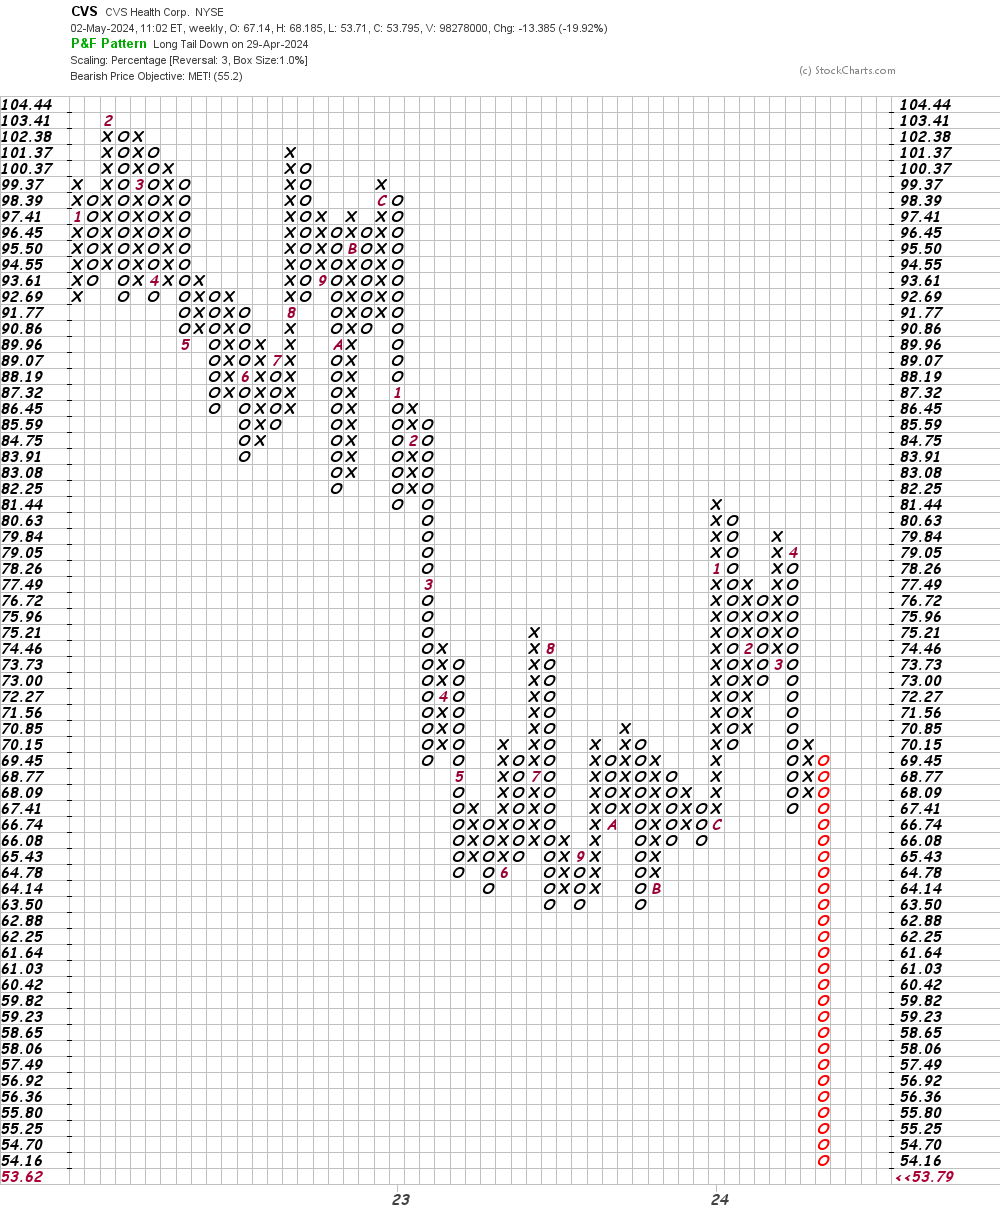
In this weekly Point and Figure chart of CVS, below, I can see that the shares reached and exceeded a price target in the $55 area.
Bottom-line strategy: CVS has been punished enough. It has made a "round trip" on charts and reached major downside price targets. This does not make the stock a buy but it does suggest that the worst could be behind it.
Employees of TheStreet are prohibited from trading individual securities.