Coinbase: The Path of Least Resistance Looks Lower
Let's check out the technicals of COIN.
You've reached your free article limit
You've read 0 of 1 free Pro articles.
Coinbase Global COIN is a technology company that operates cryptocurrency exchange platforms. Bitcoin futures are under selling pressure lately and could fall even further. Will this impact the price of COIN?
Let's check out the technicals of COIN as the charts show signs of more weakness ahead.
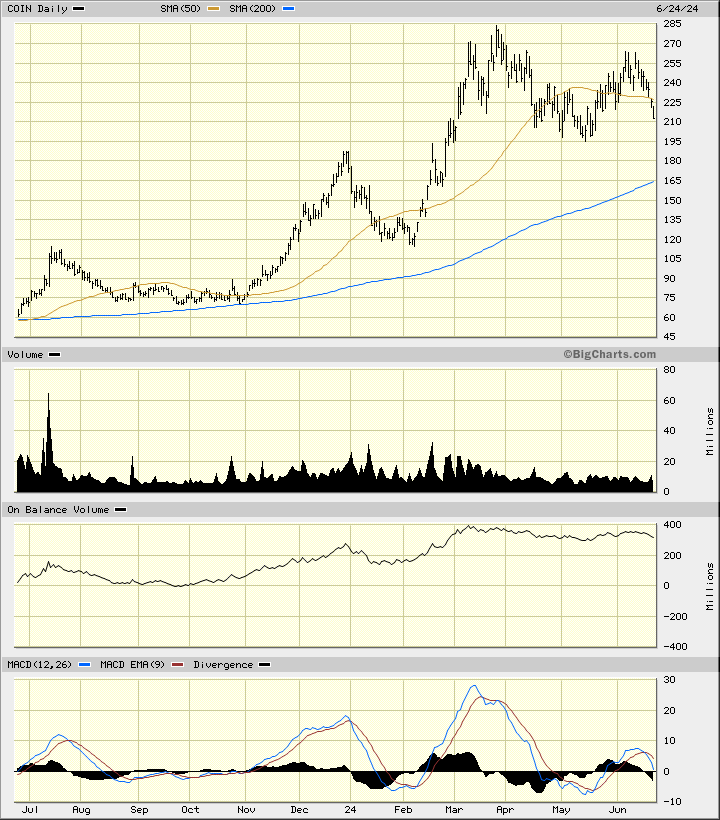
In the daily bar chart of COIN, below, I can see that the shares have made a high in late March and again in June. COIN trades below the declining 50-day moving average line and above the rising 200-day moving average line.
The On-Balance-Volume (OBV) line has moved sideways to lower since March and suggests we are seeing a shift by investors from aggressive buying to aggressive selling. The trend-following Moving Average Convergence Divergence (MACD) oscillator is pointed lower and only stands slightly above the zero line.
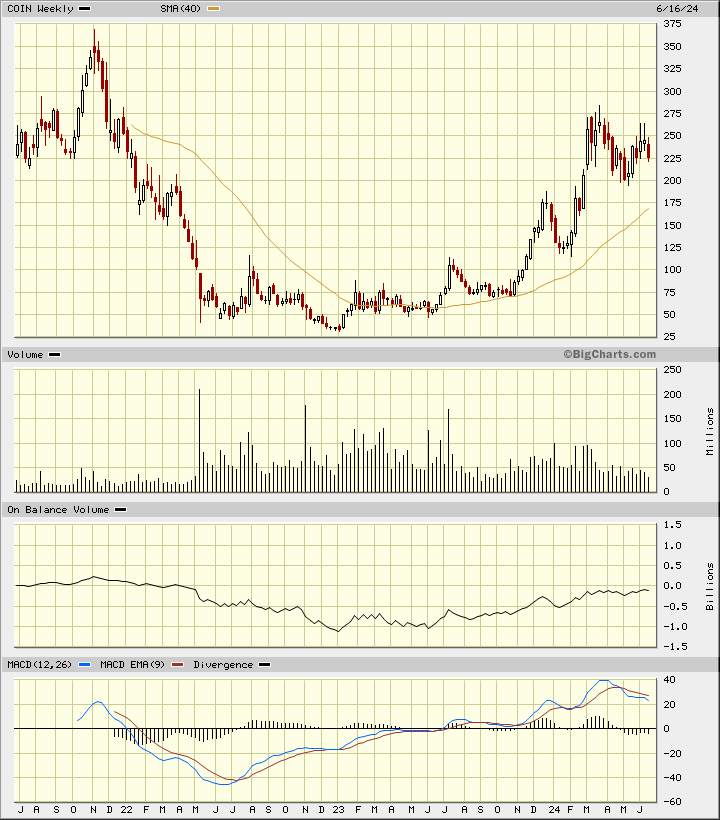
In the weekly Japanese candlestick chart of COIN, below, I see a pattern that suggests further weakness ahead. There are a number of upper shadows on the candles in March and June telling me that traders are rejecting the highs. The 40-week moving average line has a positive slope but it is a lagging indicator.
The weekly OBV line has been stalled the past four months. The MACD oscillator has crossed to the downside and is correcting lower.
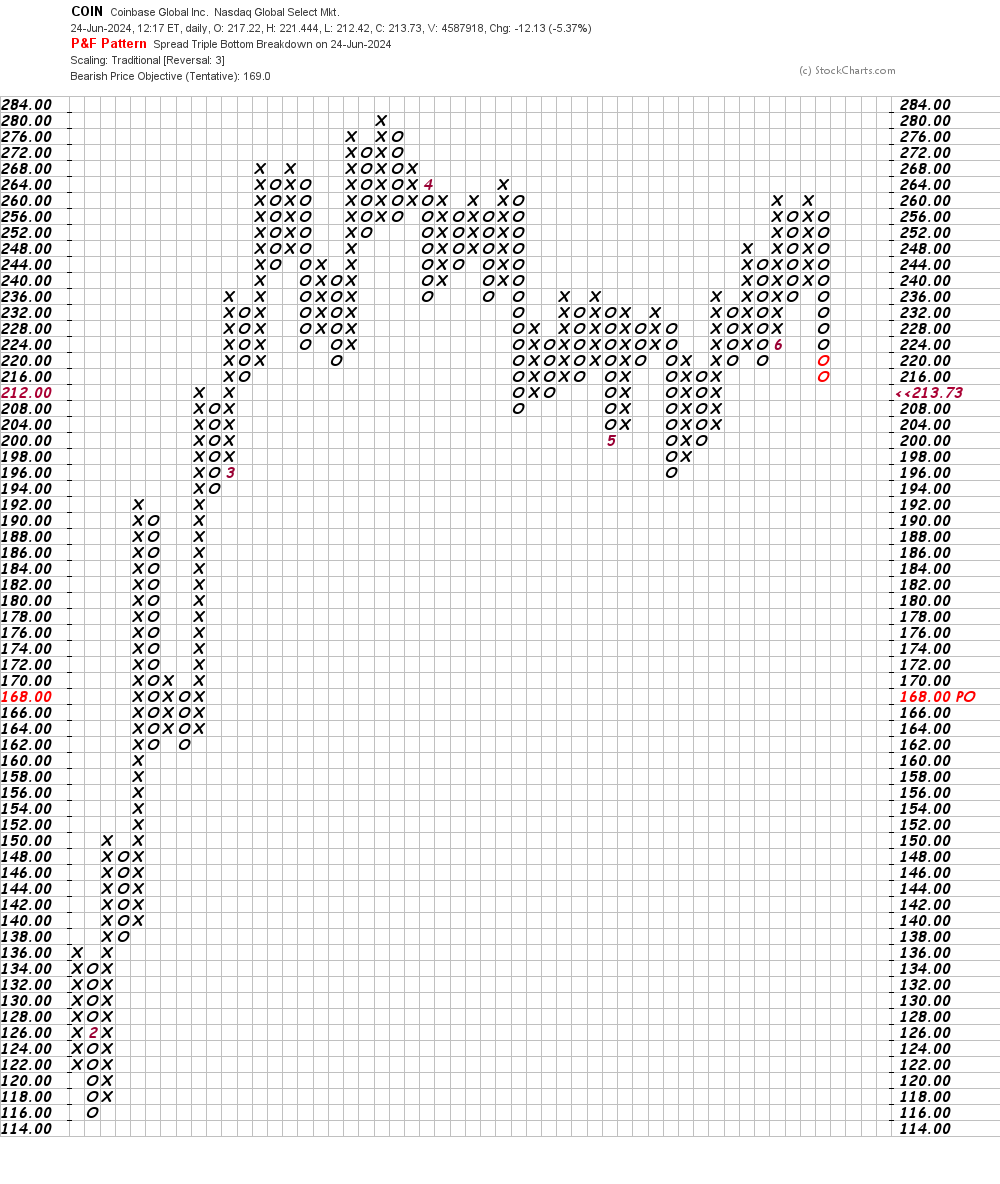
In this daily Point and Figure chart of COIN, below, I can see a potential downside price target in the $169 area.
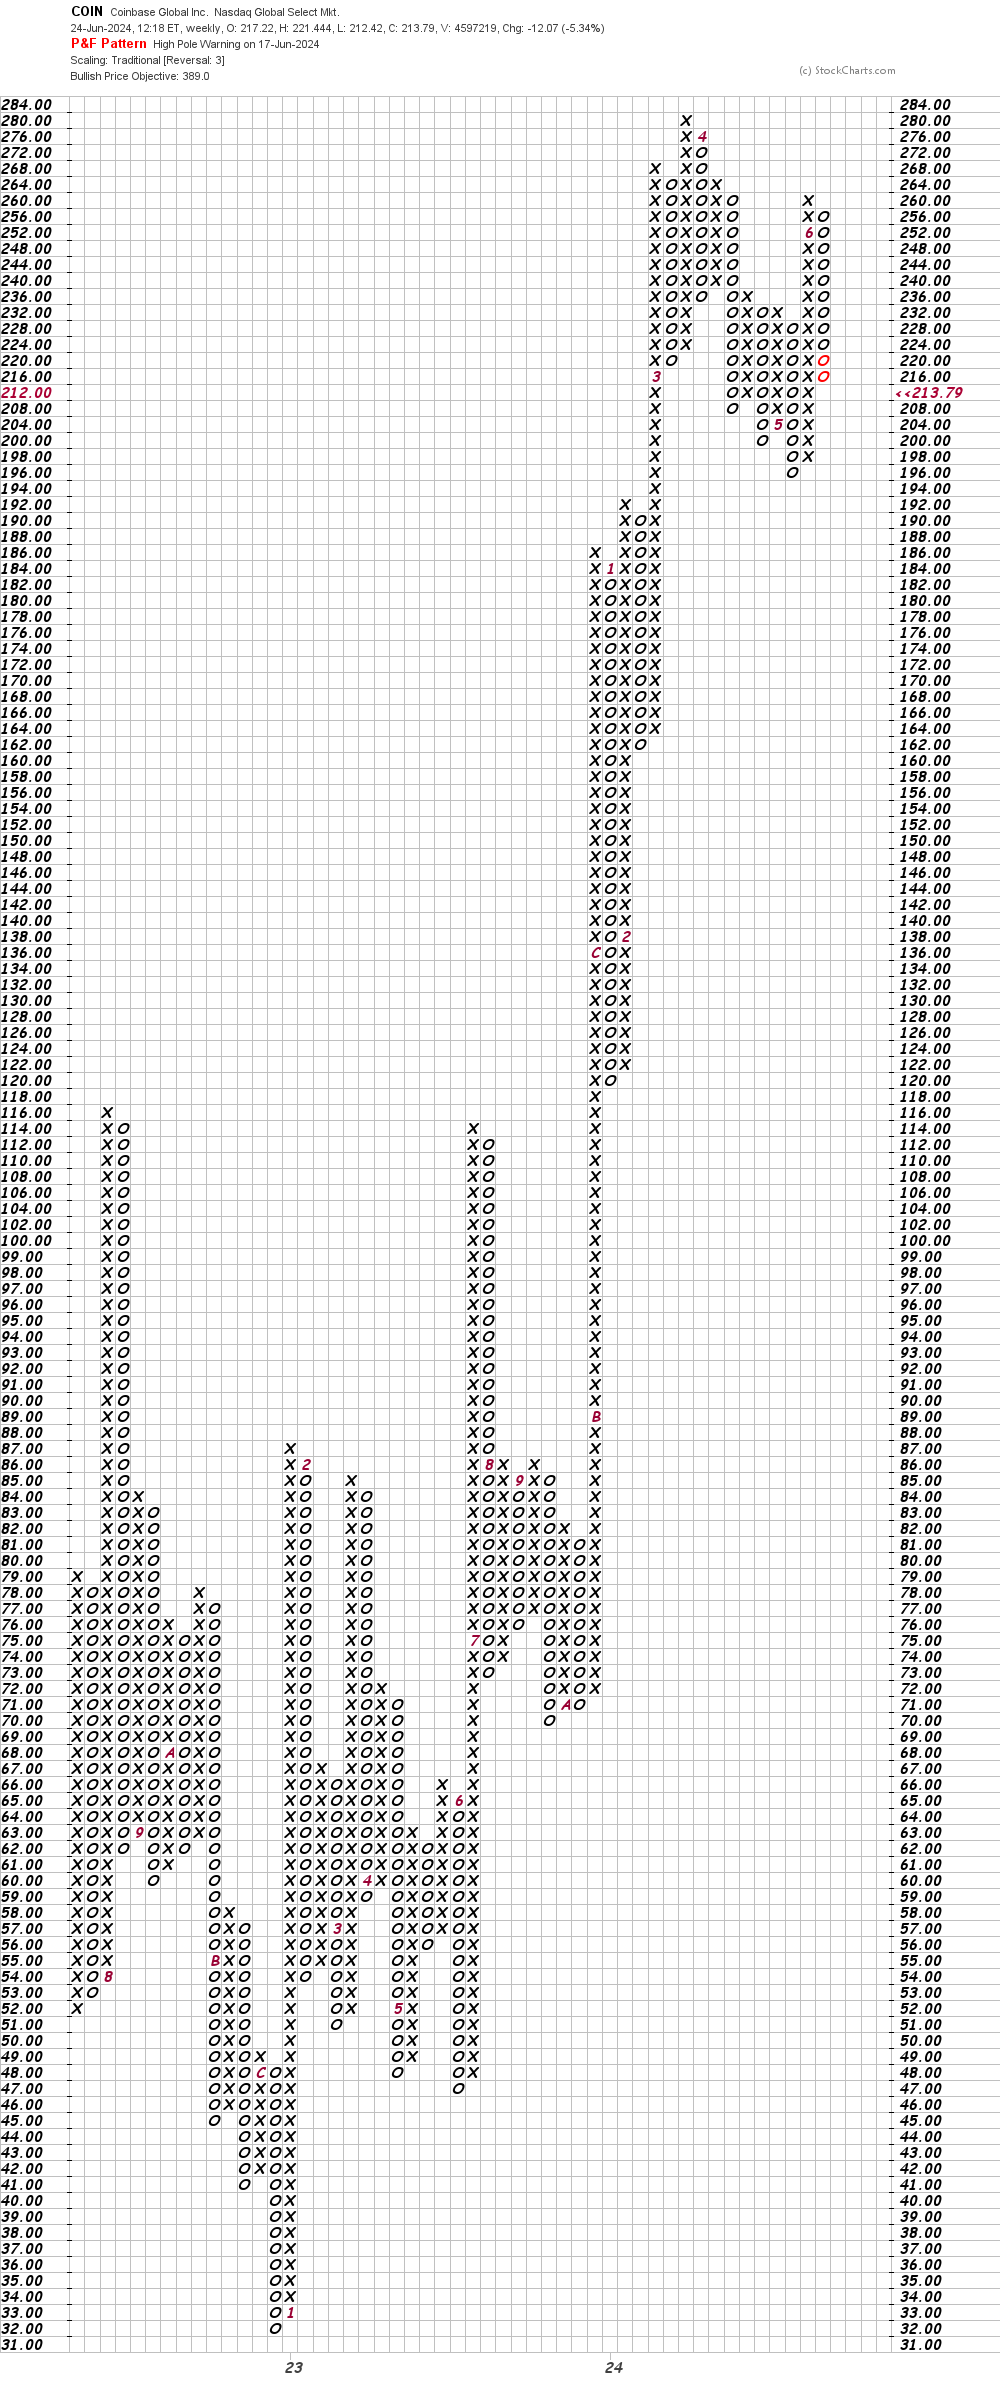
In this weekly Point and Figure chart of COIN, below, I can see an upside price target in the $389 area. A trade at $194 should turn this chart bearish.
Bottom-line strategy: I look for the charts of COIN to weaken over the next several weeks. A break of the May lows in the $200-195 area is likely to precipitate further declines.
Employees of TheStreet are prohibited from trading individual securities.