Closer to Overbought Every Day
Looking for the oscillator to get overbought later this week. We'll also review W, IGV, SMH, TEAM, ADBE, XOM, and AMD.
You've reached your free article limit
You've read 0 of 1 free Pro articles.
The Market
Can I even call it a rally if we rallied and gave it up? We still have a chance to rally again tomorrow, though. I really would like to see a rally into the end of the week, or at least one more time.
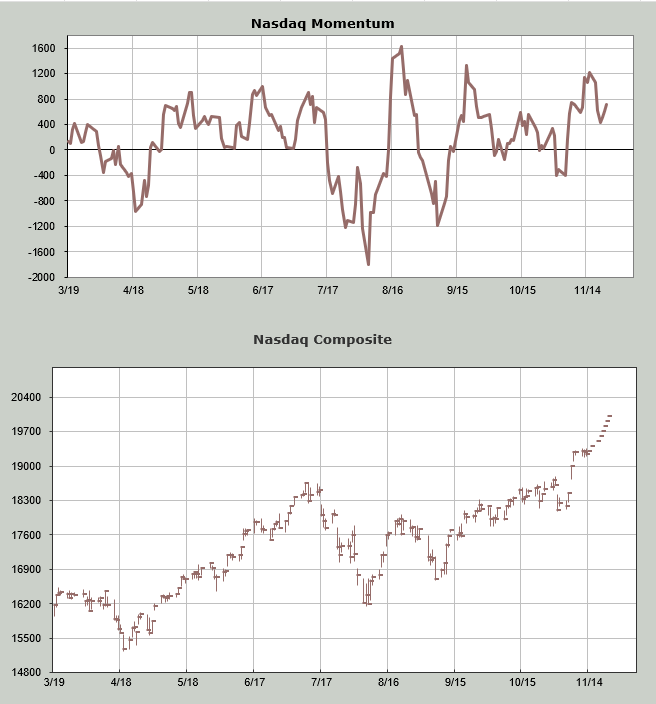
It’s not just my own Oscillator that will get overbought on Friday. Earlier this week, we looked at the Russell Momentum Indicator showing it gets overbought this week. Now let’s look at the Nasdaq Momentum Indicator. I plugged in closes over the next week to get Nasdaq to 20,000. We look for the point in time that the indicator peaks and rolls over while price keeps rising because that is the definition of overbought. That occurs on Friday.
Again, you need not mark the date as gospel, but it gives us the time frame, and it means we are close.
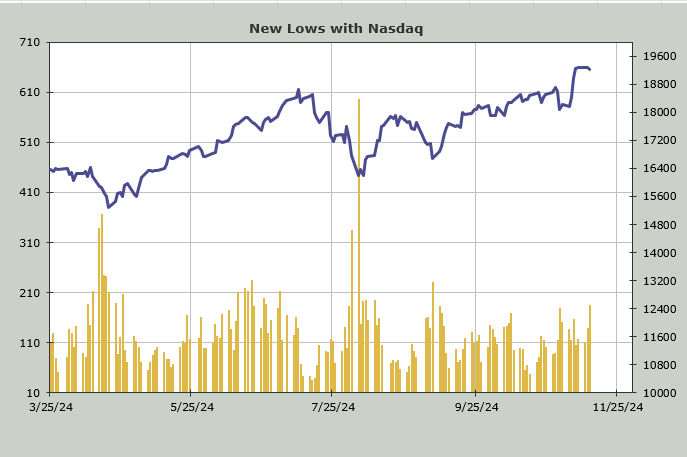
The number of stocks making new lows expanded yet again. Yesterday, we looked at the NYSE new lows, and today, I share Nasdaq’s, which are a smidge more than they were just before the election (with the Nasdaq around 18000). So here we are with Nasdaq at new highs and the spread between highs and lows is not even 90. A month ago, in mid-October that spread was around 250.
Breadth was negative once again today, so the McClellan Summation Index fell some more. It now requires a net differential of +1200 advancers minus decliners on the NYSE to halt the decline.
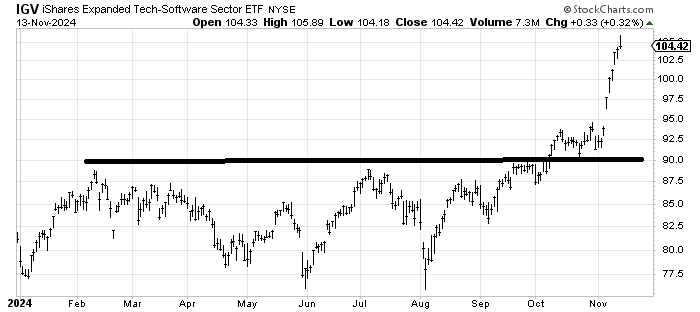
I would note that today seems to be the day everyone discovered software stocks. IGV (a fave of mine a month or so ago) has burst upward in the month of November. That base it broke out of measures to 103-105 which is where it got to today. It’s over-extended and vulnerable to a correction.
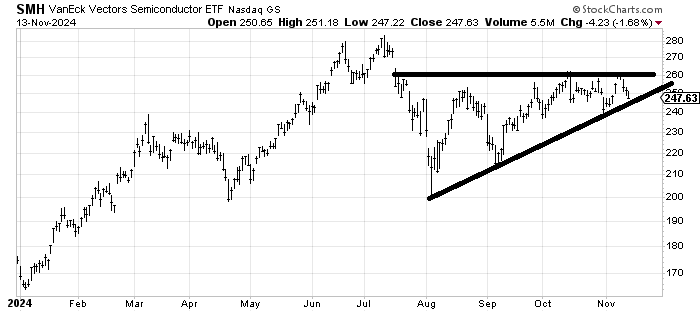
They seemingly also discovered how bad their beloved semis have been. I have not been a fan of the semis for a while. I have not been bearish but just not willing to get on board. I’m still not. But let’s look at SMH anyway.
It is sitting at an uptrend line but it also has support around 240. It’s been red for four straight days, something it hasn’t done since March. That means it is a little bit oversold. I will say this: if the semis can stay down with some pressure—maybe even break the 200 dma that it is sitting on now—in the next few days, maybe it sets up a trade into NVDA earnings next week because surely a break of the 200 dma will get folks chatting bearishly.
New Ideas
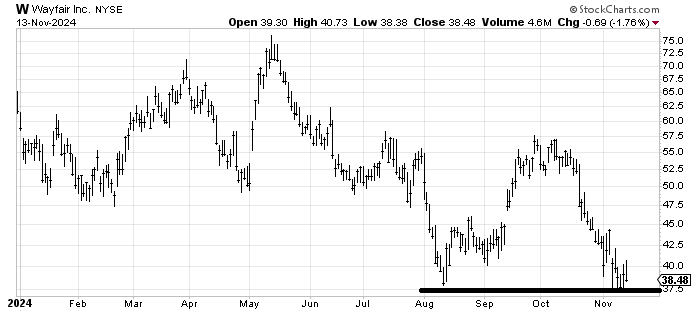
For the person who keeps asking about Wayfair W the stock did in fact come down ‘into the 30s’ and so far has held. If it can hold this 37.50 area it would be good for another trade (up).
Today’s Indicator
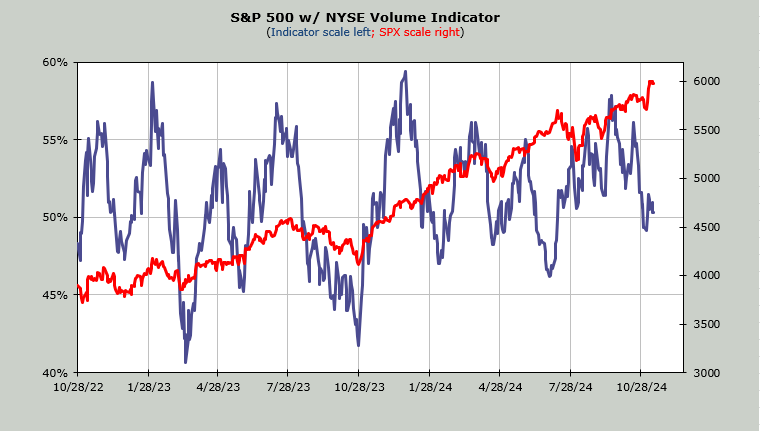
The Volume Indicator sits at 50%, despite the rally we’ve seen. Recall all those days that upside volume has been pathetic. This reflects that.
Q&A/Reader’s Feedback
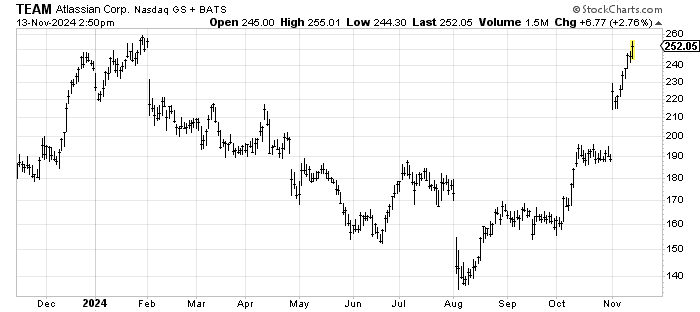
I have liked software stocks for a few months now (remember the big base in IGV?) so I should like Atlassian TEAM yet I look at the chart and I see a stock filling a gap from February and kissing the old high. I cannot chase such a move. Should it pullback and set up a pattern again I’d be happy to believe it will surge through the old high and look fresh but this set up looks vulnerable to profit taking to me.
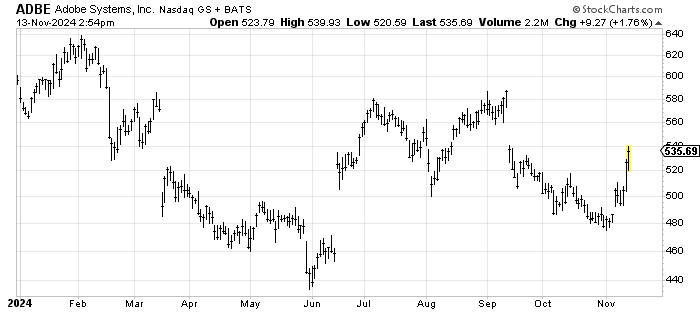
I know TEAM and ADBE are not in the same business but both are software stocks and I did recommend Adobe a few times in the last month. I think that stock ought to fill that gap at 560 and maybe do more. A dip would be nice.
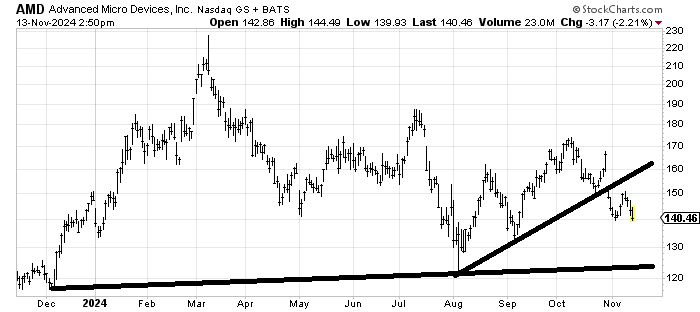
I want to like Advanced Micro Devices AMD but I just don’t see much of a reason yet. I would actually like to see it crack 140, retest that 120-130 area and get a bit of hysteria over the semis and then maybe I’d find a reason to expect more than just a short term bounce.
See the way it broke 140 and shook everyone out in early August? Or even in early May. That to me would be a more interesting set up.
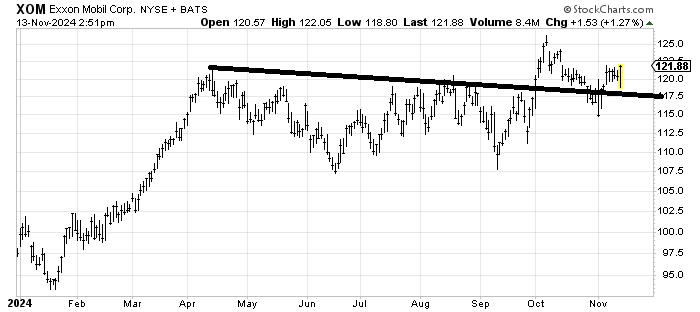
Exxon XOM has a measured target in the 130+ area. It’s been a stock I have liked for a while. In fact I liked it back in August when it first tagged 120 and then it broke, shook everyone out and off it went. It’s still a good chart.