Can You Feel It? The Sentiment Shift Has Begun
Momentum traders have a new bone to latch on to, which is great news for one group, but not for another. Plus, the selling is real and a look at Snowflake, Super Micro and more!
You've reached your free article limit
You've read 0 of 1 free Pro articles.
The Market
One thing is for sure in this market. Once the momentum folks get hold of a trend they don’t let go, like a dog with a bone.
The S&P 500 is now down 5% from the highs and it appears it might be red for the month of July. That is great news for stock pickers and not such great news for the indexers.
Breadth was good Thursday but considering the Russell 2000 was up 1% it was rather tepid compared to that. However, it wasn’t good enough to change the indicators. By that I mean the McClellan Summation Index is still heading lower.
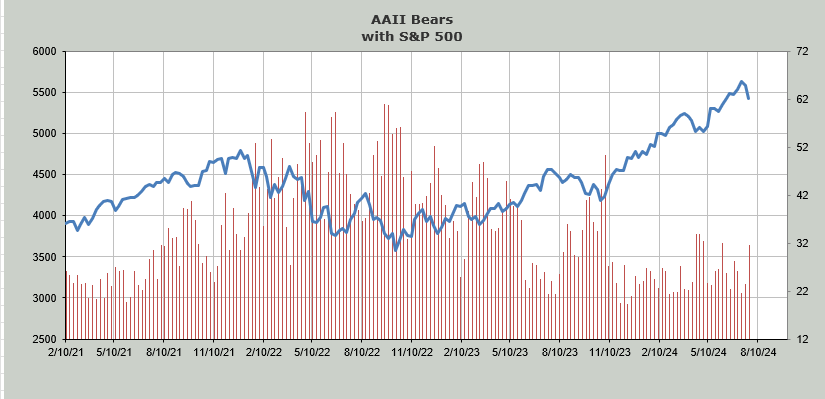
But the move in the indexes over the last week has been felt by some folks. The American Association of Individual Investors (AAII) Bulls dropped 9.5 points to 43.2% and the Bears lifted about 7 to 31.7. If we can get some more downside in the next few weeks we might just see more bears than bulls. This would be a plus for the markets.
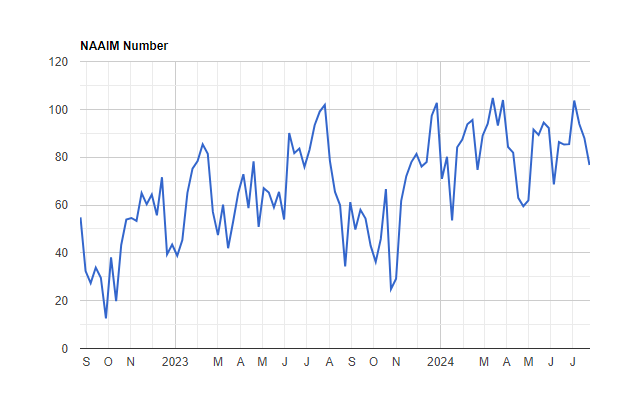
The National Association of Active Investment Managers (NAAIM) folks continued to pull in their horns. A few weeks ago they were on margin with their exposure over 100. Now it’s in the mid-70s. As a reminder, in April they got to 60.
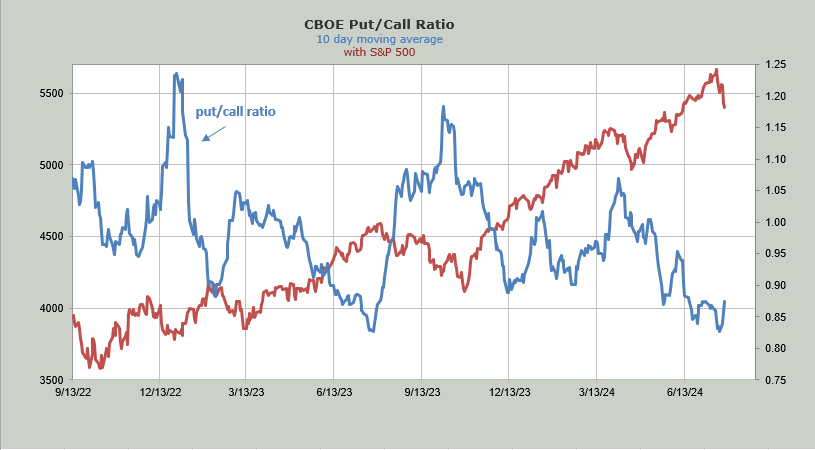
Then there are the options players. Three days ago I noted that the ISE equity call/put ratio had slipped to its lowest level since early June. Then we saw the CBOE’s put/call ratio rise to the highest reading since late May. In other words, the sentiment shift has begun. Down below you can see it clearly on the chart of the 10-day moving average of the put/call ratio as it is starting to lift enough that we can see it without squinting.
While I don’t think we have panic, I would end by noting that the volume for the QQQs has been near 60 million shares for the last two days so there is some real selling going on.
New Ideas
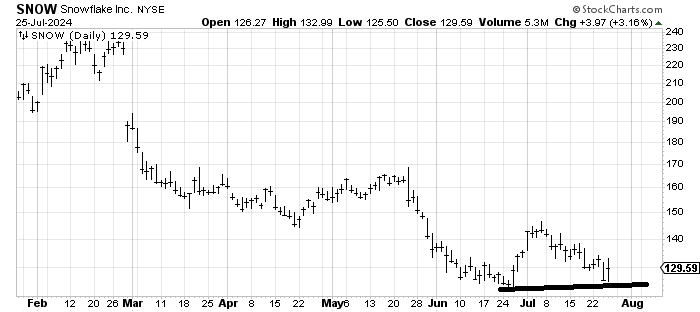
No one is buying small-cap tech, or at least they are not buying it enough or consistently enough for me to love bottom-fishing there. But I will always be drawn to a chart like Snowflake SNOW because if it turns south and breaks these recent lows I am wrong so the risk/reward is decent for a bounce.
Today’s Indicator
The 10-day moving average of the put/call ratio is discussed above.
Q&A/Reader’s Feedback
Helene welcomes your questions about Top Stocks and her charting strategy and techniques. Please send an email directly to Helene with your questions. However, please remember that TheStreet.com Top Stocks is not intended to provide personalized investment advice. Email Helene here.
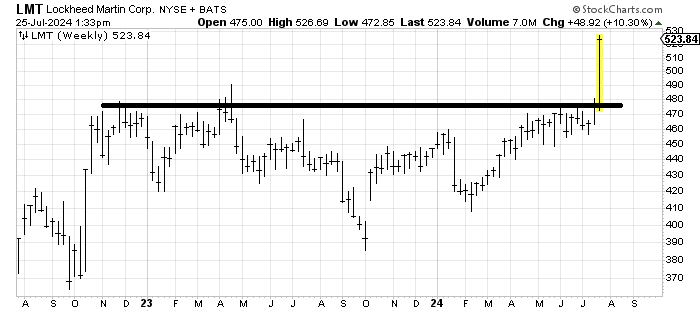
Lockheed Martin LMT finally broke out. How many months have I been waiting for this? But the question is what is the target? This is a weekly chart and the target is in the $530-550 area so my rule of thumb is if you get a 10% rally you take something off the table. Then you can use a trailing stop on the remainder.
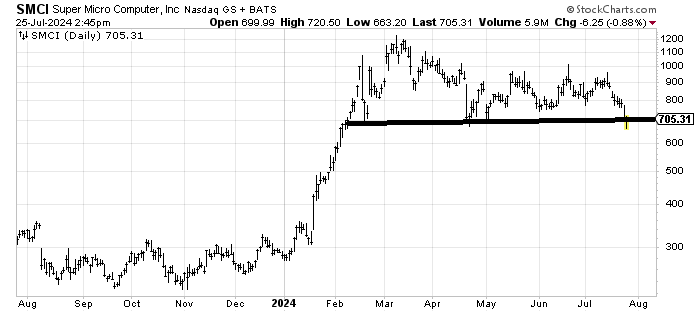
I messed up big time when I thought Super Micro Computer SMCI could rally through $1,000 and make a run. Instead it just died. Now the question is if the stock breaks $700 where does it measure to? It’s a little short-term oversold here so a break might actually be short-term capitulatory. However, if SMCI mills around here or bounces and then breaks (in a few weeks) there would be a measured target around $400 and one around $200. Gosh that seems like a lot.
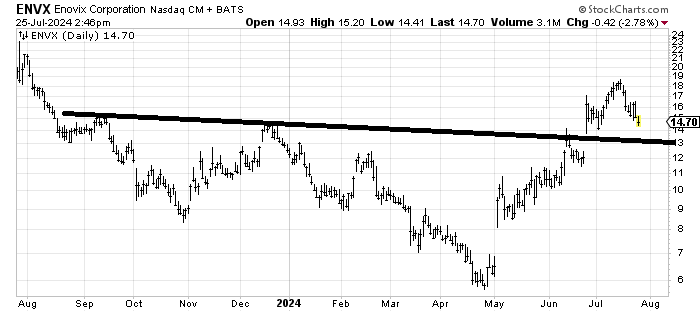
Enovix ENVX had a nice breakout and is now retracing back to the breakout. In the near term I would look to buy around $12-13. My guess is it takes a while to correct and look okay again. After all, it tripled from the May low.