Can Voya Financial Build on Its Upside Breakout?
Let's check out the charts and indicators of this financial services name.
You've reached your free article limit
You've read 0 of 1 free Pro articles.
Financial services company Voya Financial VOYA offers life insurance, annuities, mutual funds, group insurance and reinsurance.
Let's check out the charts and indicators.
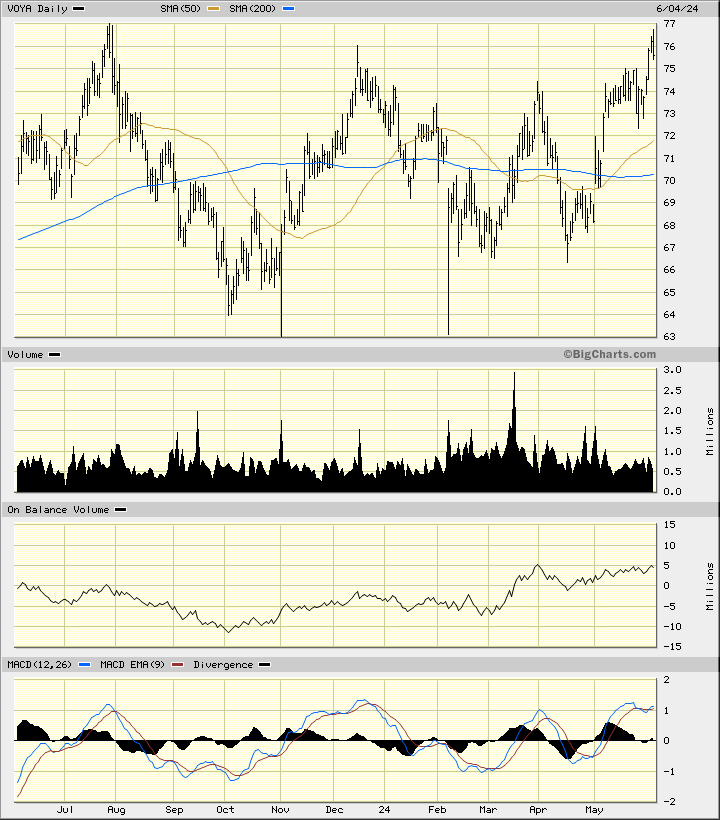
In the daily bar chart of VOYA, below, I can see that share prices have made three attempts in the past 12 months to break above the $76-$77 area. Prices have oscillated around the popular moving averages but are now trading above the rising 50-day moving average line and above the bottoming 200-day moving average line.
The On-Balance-Volume (OBV) line shows us a stepwise rise since early October. Prices made equal lows in March and April but the Moving Average Convergence Divergence (MACD) oscillator made a higher low in April than March for a bullish divergence.
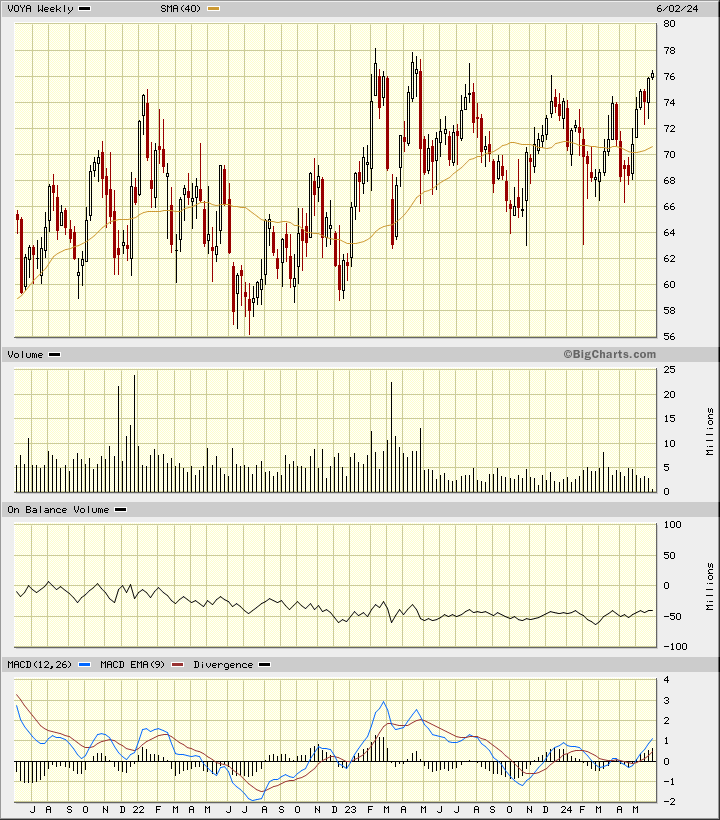
In the weekly Japanese candlestick chart of VOYA, below, I see a mixed picture. The shares have been probing the upside with tests of the $76-$78 area over the past two years. Prices are now trading above the rising 40-week moving average line.
The OBV line has been neutral for a while now but it shows some slight improvement in the past three months. The MACD oscillator is bullish as it is above the zero line.
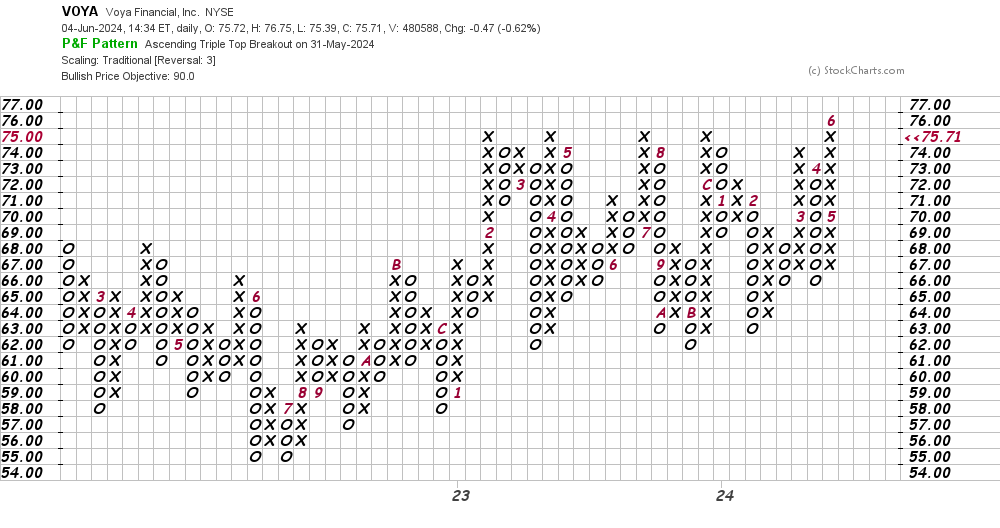
In this daily Point and Figure chart of VOYA, below, I can see that prices have just made an upside breakout with a price target of $90.
In this weekly Point and Figure chart of VOYA, below, I can see the same upside breakout but with a price target of $96.
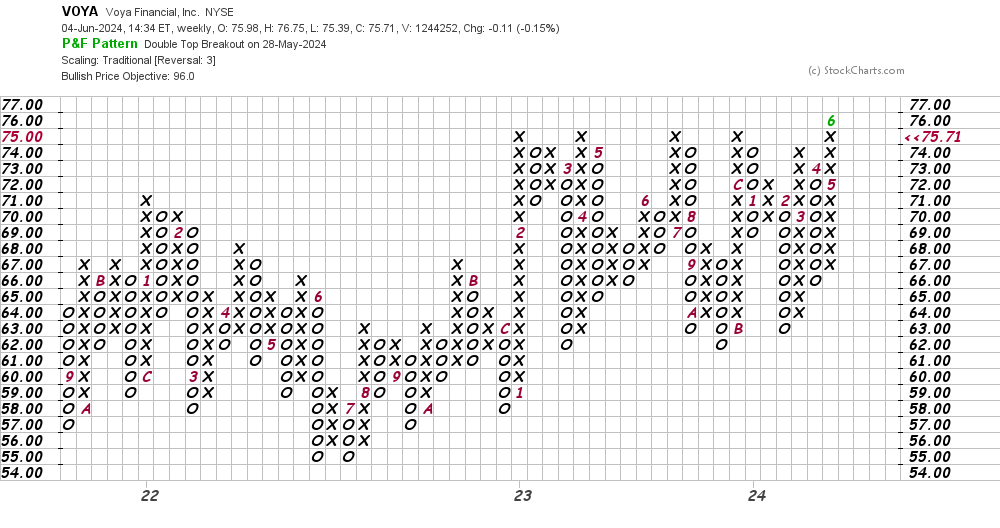
Bottom-line strategy: Traders who can risk to $72 on VOYA could go long at current levels. My price targets are $90 and $96.
Employees of TheStreet are prohibited from trading individual securities.