Can Regeneron Pharmaceuticals Keep Regenerating This Rally?
Let's check the charts of this major pharma player to see what target the doctor orders.
You've reached your free article limit
You've read 0 of 1 free Pro articles.
Regeneron Pharmaceuticals REGN is big pharma player with some pretty cutting edge tech.
Let's check out the charts and indicators (and the microscope slides).
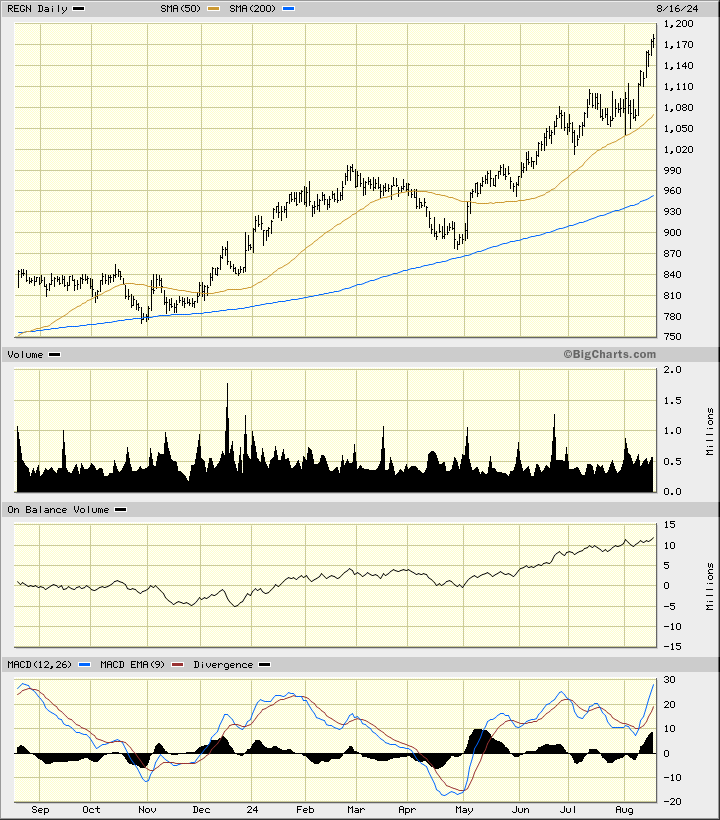
In this daily bar chart of REGN, below, I can see that prices have rallied strongly since late October. REGN trades above the rising 50-day moving average line and above the rising 200-day line. Some analysts would consider REGN extended, as in overbought, when compared to the 200-day line.
The On-Balance-Volume (OBV) line has been on an upward path since December and confirms the price gains we have seen in the past year. The Moving Average Convergence Divergence (MACD) oscillator is in a bullish alignment above the zero-line.
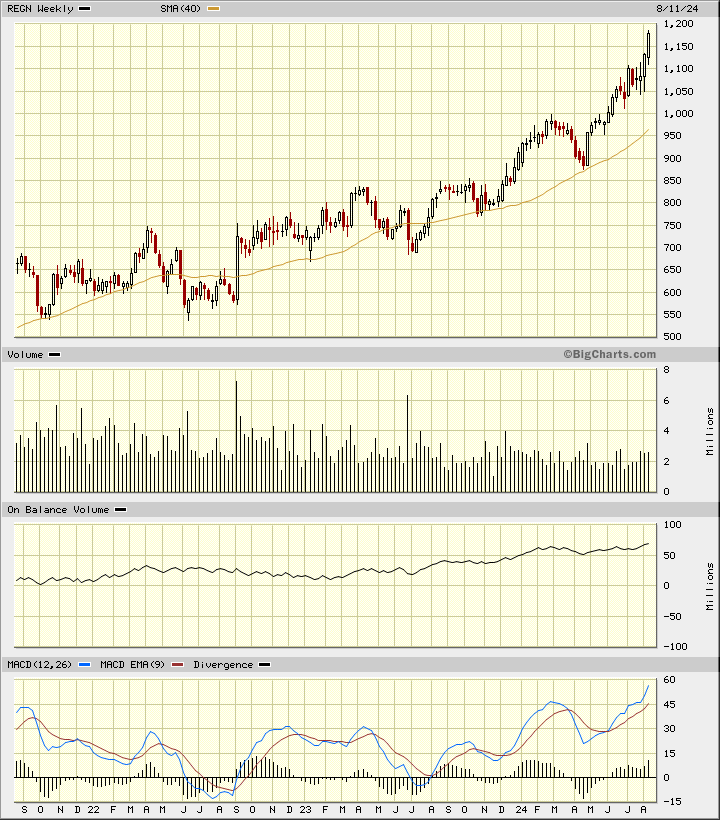
In this weekly Japanese candlestick chart of REGN, below, I can see that prices have more than doubled in the past three years. REGN trades above the rising 40-week moving average line. The OBV line shows a positive move the past year or so. The Moving Average Convergence Divergence oscillator remains in a bullish alignment above the zero-line.
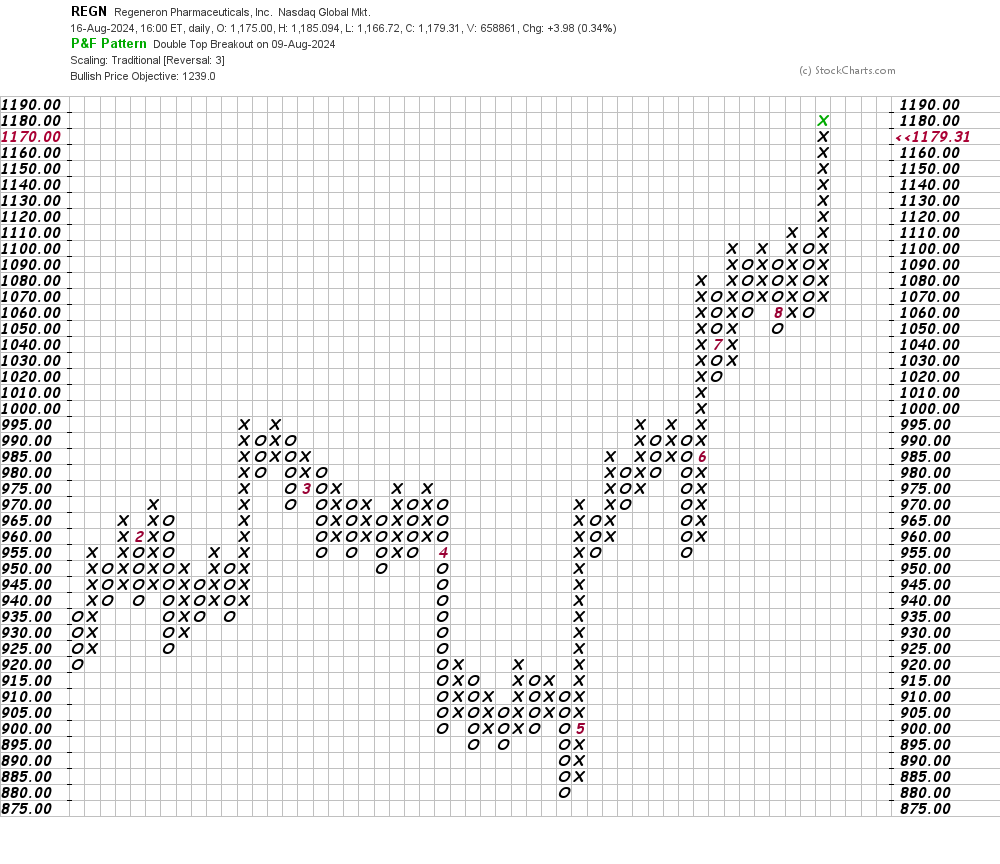
In this daily Point and Figure chart of REGN, below, I can see that the software is projecting an upside price target in the $1,239 area.
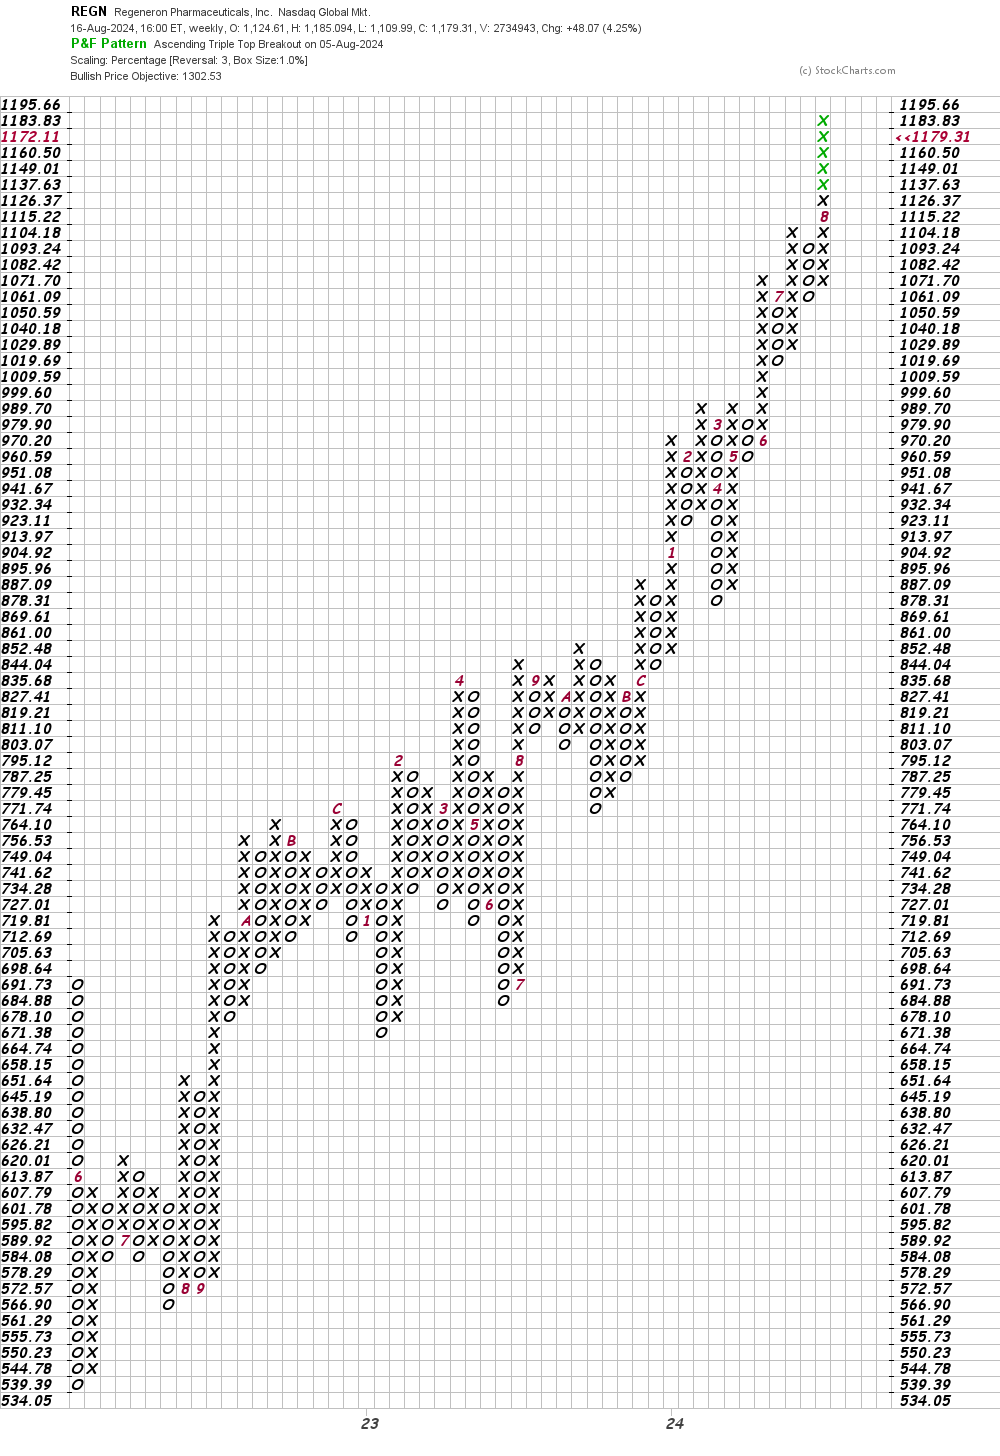
In this weekly Point and Figure chart of REGN, below, the software shows us a target in the $1,303 area.
Bottom line strategy: Traders who are long REGN (see my last update from Nov. 3) should continue to hold risking to $1,115. The $1,300 area is my next price target.
Employees of TheStreet are prohibited from trading individual securities.