Can Nike Just Do It and Find a Bottom Before the Market Gets Overbought?
The market didn't do much today! So, let's look at the indicators and look at reader questions.
You've reached your free article limit
You've read 0 of 1 free Pro articles.
The Market
I know it seemed like the market did very little today. Heck, volume for the QQQs was 16 million shares. I can’t recall the last time the QQQs, which were the star of the day, traded such low volume on a non-holiday trading day.
Breadth wasn’t terrible but it was red. But wait, there’s more.
The Transports lost over two percent and no one even mentioned it. That’s a lot. The Utes were down. Again. In fact the Utes have been red for six of the last seven trading days. Recall that they led the bonds up.
The staples were down. The REITs were down. The Banks were down. Again, remember that the Staples, REITs and Utes were the groups that gave us the heads up for bonds. And yes the bonds were down too.
Sure I expected the bonds to pullback but the fact that the other groups got hit so hard has my antenna up, especially because we will be overbought by the end of the week. My own Oscillator gets overbought at the end of the week. The Nasdaq Momentum Indicator does as well.
I plugged in daily closes up to 20,000 for Nasdaq and while it doesn’t turn lower, you can see it stops going up. As I have noted I think the market pulls back next week and then sets up for another rally for Christmas and I think today’s action confirms that view for me.
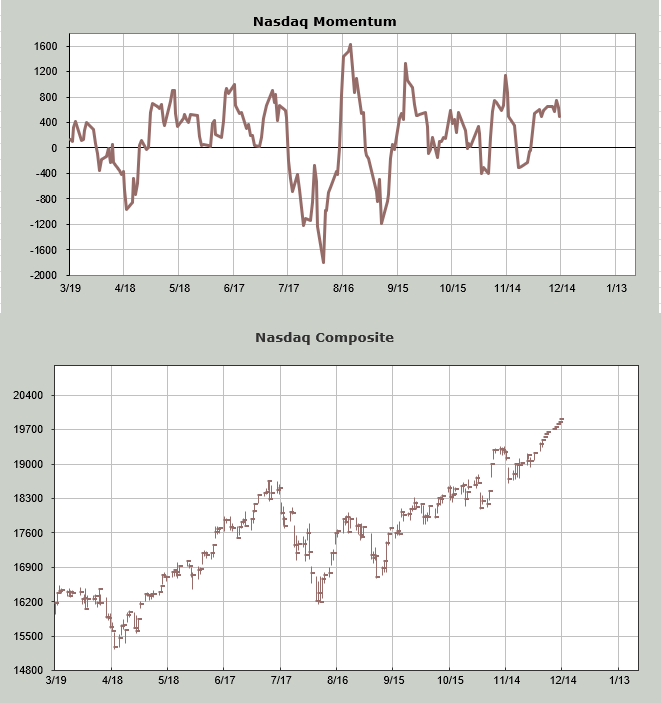
There was no change in the sentiment indicators today but that low volume and the lack of change in the sentiment –and maybe the fact that no one seems to think we can go down at all in December has me thinking we should expect some volatility next week.
New Ideas
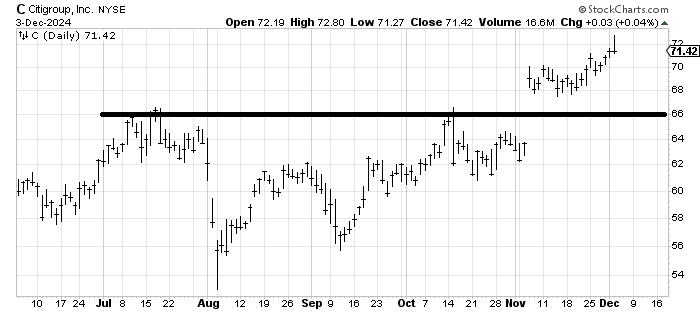
I was asked to look at Citigroup C which turns out to be the bank that hasn’t gone down in the last week. Today’s action wasn’t great though, closing at the low of the day. The stock has a measured target around 76-ish. Was today close enough? Maybe. But the stock hasn’t done anything wrong yet, just that it is the outlier in the group. Maybe take a few profits and hold on to the rest.
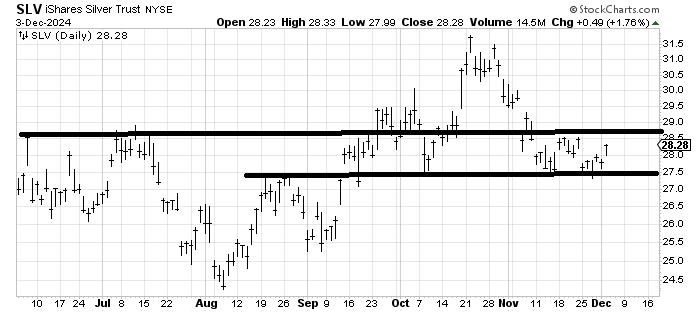
I was also asked to look at SLV an etf to be long silver. I am intrigued. It bounced off support at 27.50 and a move through 28.75 would be good.
Today’s Indicator
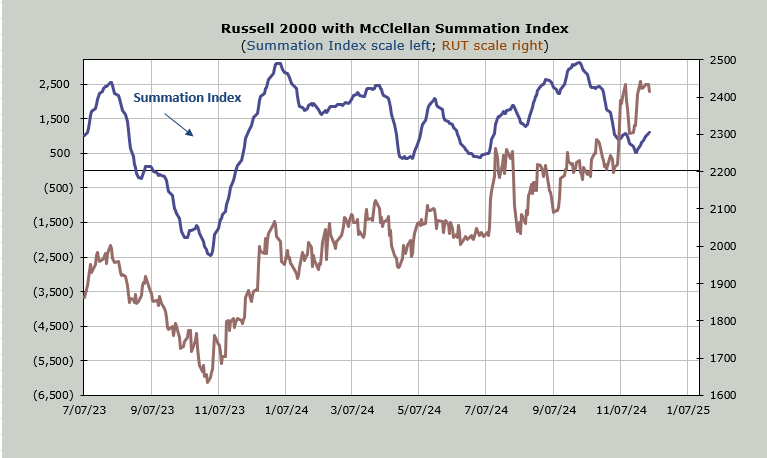
The McClellan Summation Index had a change today. It is still heading upward grudgingly but now it will require only a net differential of -400 advancers minus decliners on the NYSE to halt the rise.
Q&A/Reader’s Feedback
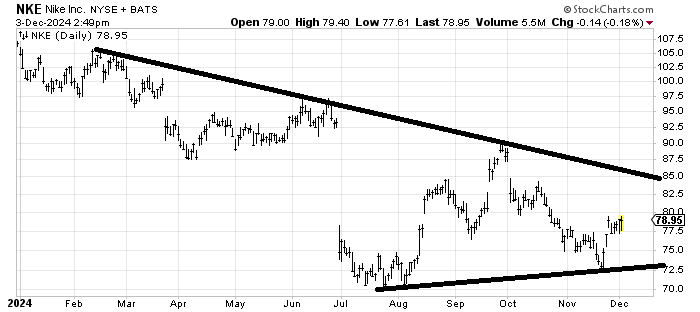
Nike NKE keeps trying to bottom. It tried in the spring, only to give way in June/July. It also tried in the fall and then came October. So do I trust it? I do not. But if it gets over 80 I would guess it makes a good try at 85-87.
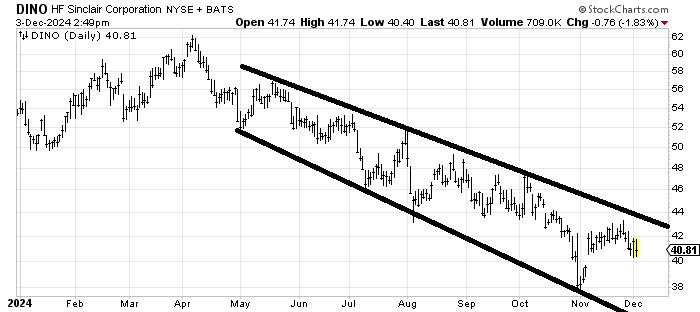
HF Sinclair DINO has one of the best ticker symbols out there but when it comes to the chart, well, I can’t say the same. It’s just been a steady downtrend all year and thus far there is no sign of stopping.
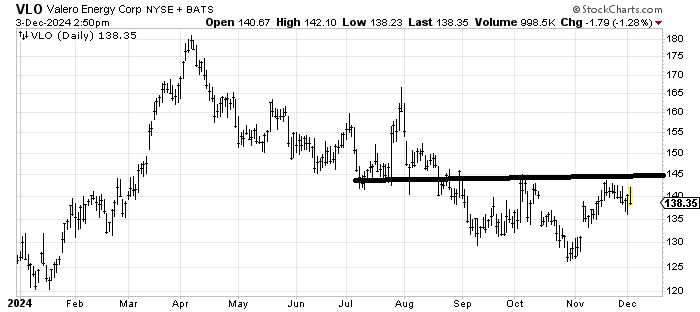
However, Valero VLO is in the same business and I was asked about it a month or so ago and said I thought it was trying to bottom. If VLO can fill that gap at 130 and rally it would look like a head and shoulders bottom so I’d be cheering a gap fill at 130 to buy.
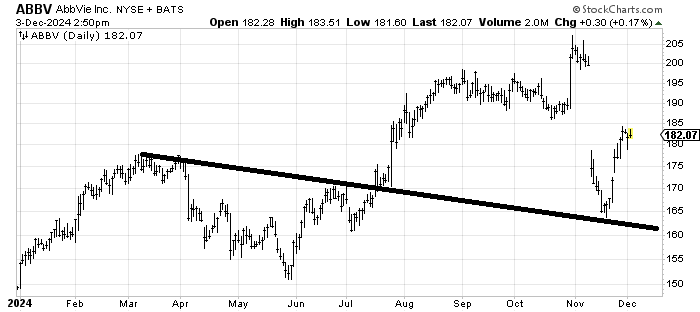
My problem with AbbVie ABBV is that it is in the middle of nowhere right now. It’s not down and out and it has rallied hard from support. So a gap fill is possible but seems unlikely without more work to be done. It’s a chart with no edge.
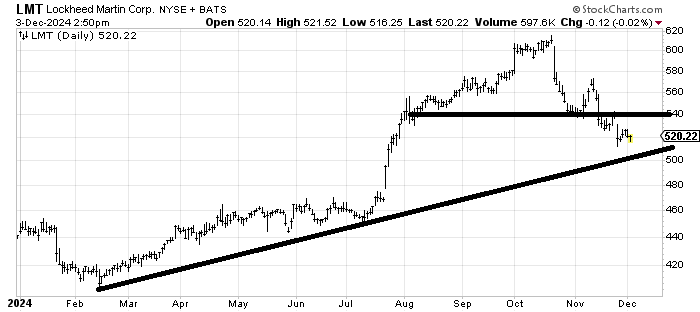
Lockheed Martin LMT still has resistance at 540 but I would either like to see it test 540 or 500-ish (the uptrend line) to give us something to hang our hat on. At 520 it sits right in the middle.
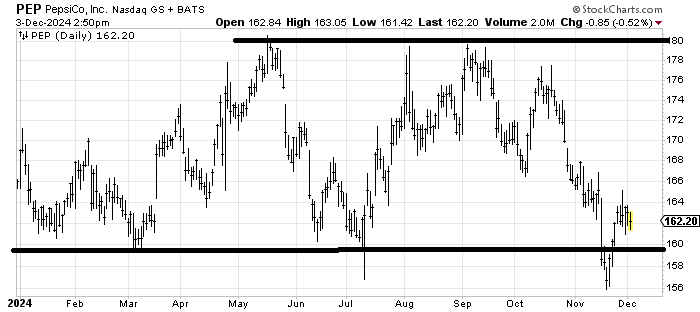
We have looked at Pepsi PEP before and its support at this 160 area. I would say If it is still above 160 as we get closer to year end then it would probably be a good candidate for a January rally.
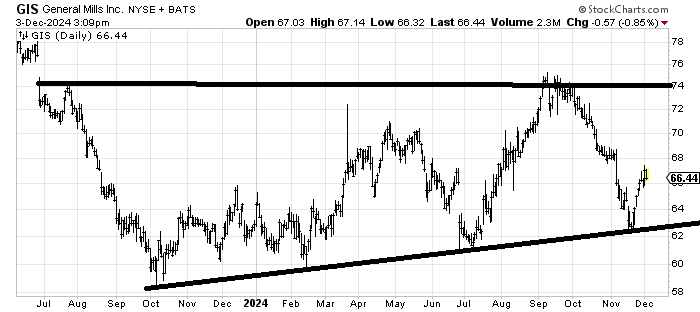
On a longer term basis, the food chart that intrigues me is General Mills GIS because it has gone sideways for a year and a half and that lower line has been perfect. A trip back near that line into year end would be buyable on this chart because the risk/reward would be good.
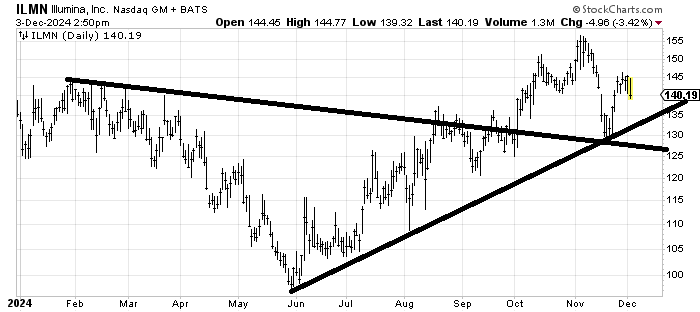
Illumina ILMN has some very interesting support in the 125-135 area. The longer term chart (not shown) is interesting so I’d like to see how ILMN handles a pullback into that support zone. Please ask me again on this if it gets down there.