Can Boeing Stabilize Here or Is There More Risk?
Further declines cannot be ruled out.
You've reached your free article limit
You've read 0 of 1 free Pro articles.
The Boeing Co BA fell sharply Thursday in part with weakness in the broad market averages and maybe in reaction to the CFO's comments about plane output.
Let's check out the position of the charts and indicators.
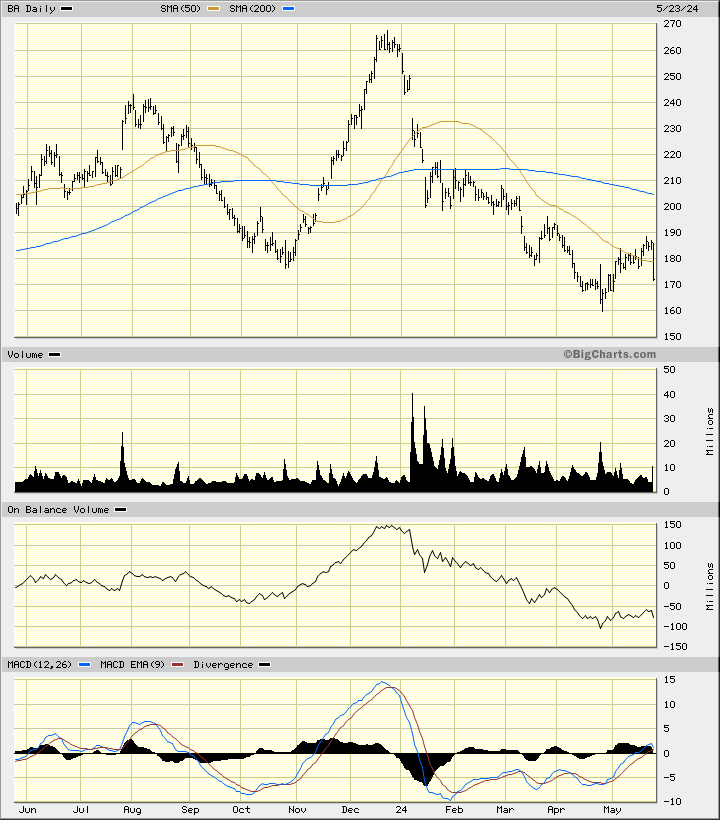
In this daily bar chart of BA, below, I can see that prices have declined below the 50-day moving average line and remains below the declining 200-day moving average line. The trading volume has been more active over the past five months and tells me that traders are voting with their feet.
The On-Balance-Volume (OBV) line shows weakness from December. The Moving Average Convergence Divergence (MACD) oscillator looks like it is failing to sustain a move above the zero line.
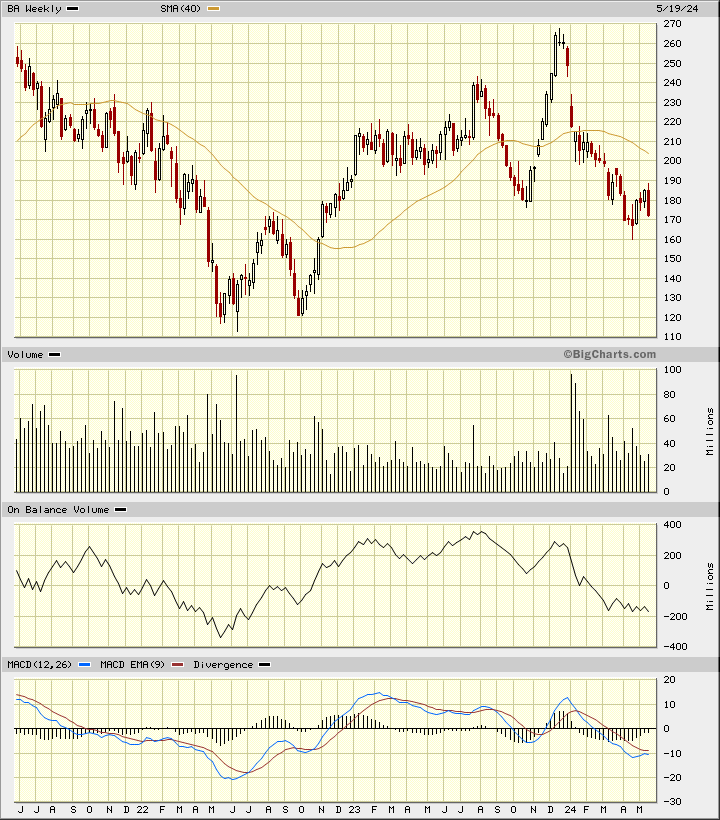
In this weekly Japanese candlestick chart of BA, below, I see a weak setup. Prices trade below the declining 40-week moving average line. The weekly trading volume has been more active than "average" the past five months and suggests we are seeing liquidation (selling).
The OBV line has been bearish since August. The MACD oscillator is in a bearish alignment below the zero line.
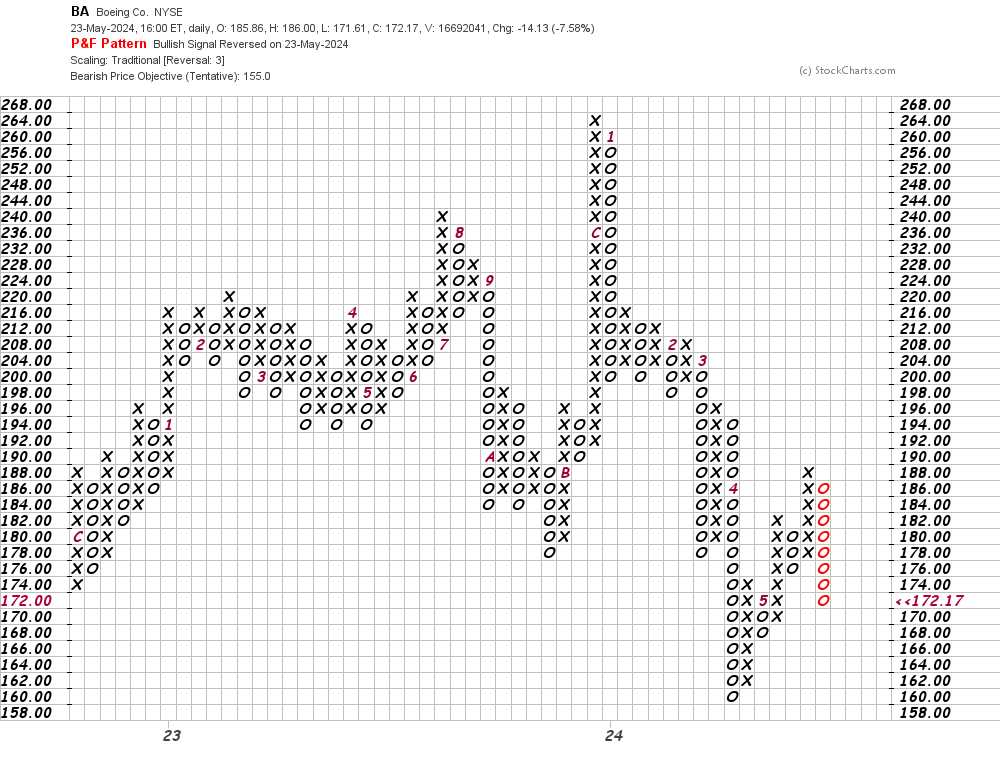
In this daily Point and Figure chart of BA, below, I can see a potential downside price target in the $155 area.
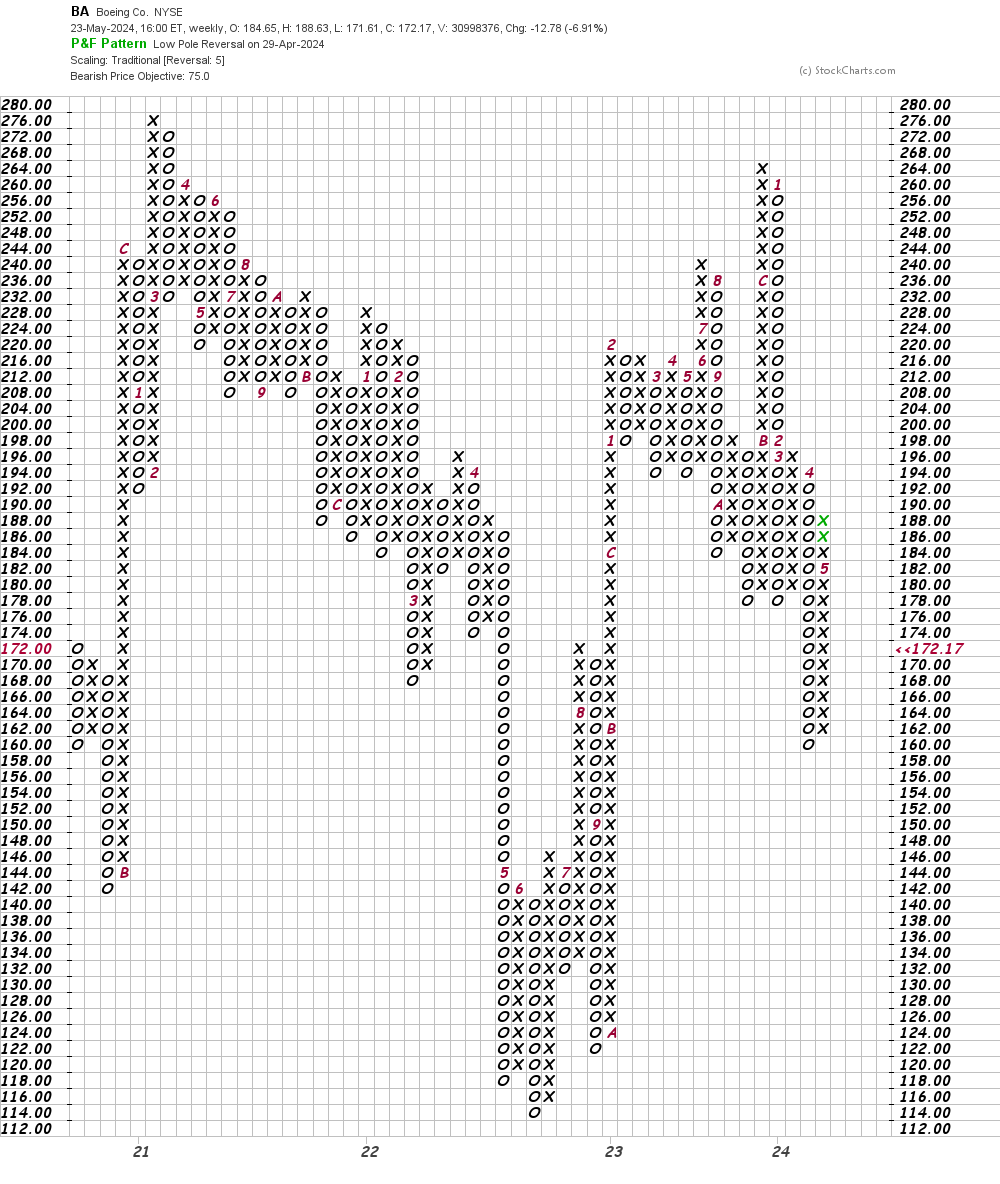
In this weekly Point and Figure chart of BA, below, I used a five box reversal filter. Here the software suggests a price target in the $75 area.
Bottom line strategy: Boeing could bounce in the short-run, but the overall condition of the charts and indicators are bearish and further declines cannot be ruled out.
Employees of TheStreet are prohibited from trading individual securities.