As the Market Moves From Intermediate Oversold, What's Next?
The indicators are improving, but at what point do they become overbought? Plus, thoughts on Copper, SMCI, DIS, and COST.
You've reached your free article limit
You've read 0 of 1 free Pro articles.
The Market
I believe the late-day sell-off in the major indexes was more about the short-term overbought condition than anything else. We are short-term overbought.
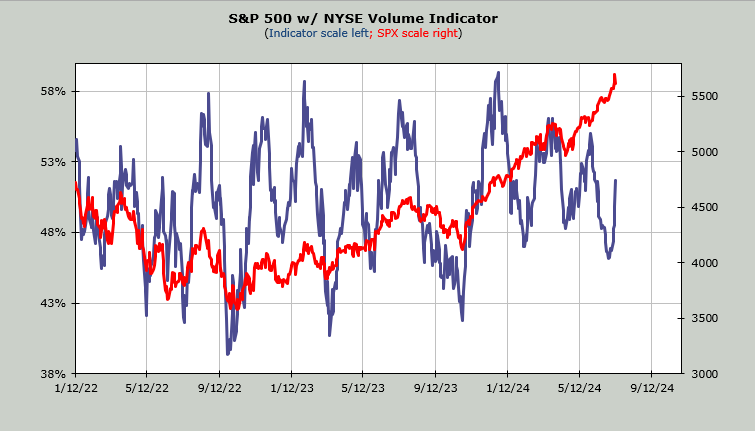
The intermediate-term indicators, which have been oversold for about two weeks now, are no longer oversold but not yet overbought. For example, the Volume Indicator, which had gotten to 46% in early July, is now at 52%. It would get overbought in the mid to upper 50s.
Based on the market we have (index movers vs the others) I really should plot this indicator against the equal weight or the Russell 2000 but here it is vs. the S&P and you can see it sits in the middle of the range now, on its way toward the top of the range.
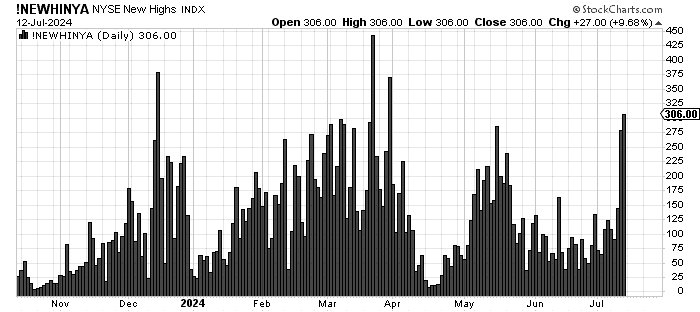
New highs improved but despite the breakout in the Russell they are still below their spring peaks. The chart of new highs is below.
Speaking of new highs, that’s the curious part of the rally in the latter part of last week. Very few of the charts made higher highs and held them. Even the biotechs (XBI) which I have been positive on for the last week or so, haven’t taken out that spring high. In that respect I would stand by what I said on Thursday evening: this looked like a giant unwind from what had been built up the last two months.
For example, the homebuilders and the transports surged. Recall Wednesday evening I noted that JBHT and PHM were on the verge of breaking down. They couldn’t quite break but instead couldn’t rally. So those two charts rallied –heck—surged. I can’t be the only one who saw those types of charts. What it did was lift them from danger, but take them nowhere special. Thus the lack of real breakouts.
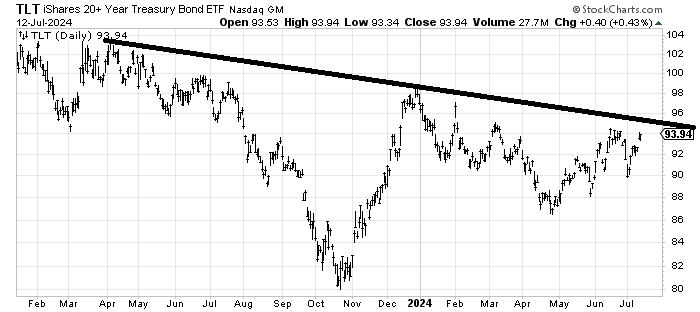
And now we find ourselves with the opposite situation. Interest rates have fallen to their support levels and are milling around down there. TLT would break out of a long term downtrend over 96-ish (about 4% on the Ten Year).
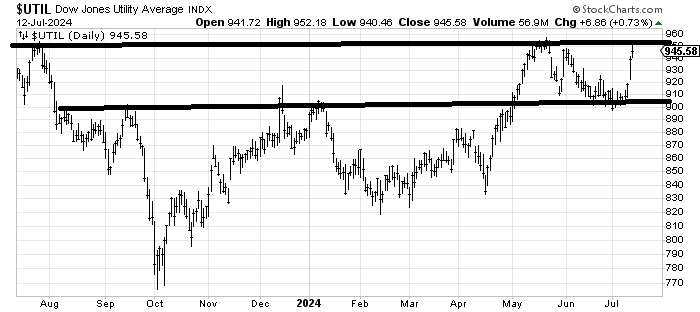
The Utes XLU, which I have also been a fan of for a few weeks now, stopped right at resistance as well.
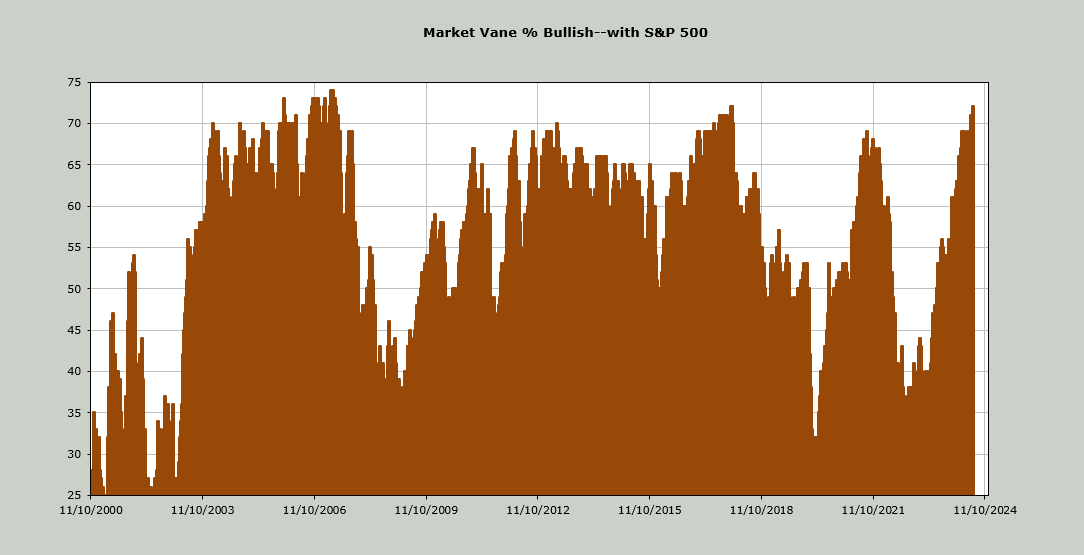
Sentiment was already bullish and has gotten more so. Take a look at the Market Vane Bulls which are now at 72. It is the highest reading since January 2018 (just prior to Volmagedden) and prior to that they reached 74 in the spring of 2007.
Let’s see if we can get some charts to set up.
New Ideas
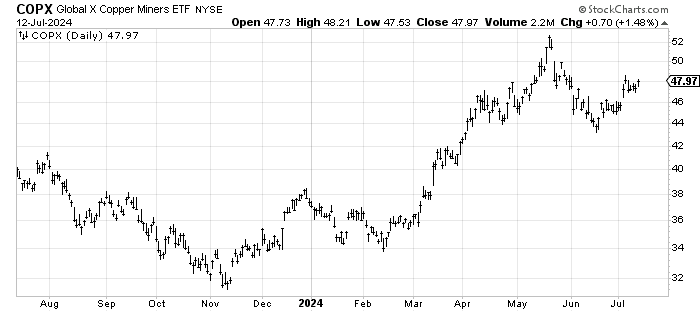
I was asked to follow up on COPX, an ETF to be long the copper miners. Remember when everyone was ga-ga over them in May? I don’t hear anyone loving on them now, which is a good thing. With the market short term overbought I’d keep a tight leash on it but COPX should make it up to fill that gap around 52.
Today’s Indicator
The new highs are discussed above.
Q&A/Reader’s Feedback
Helene welcomes your questions about Top Stocks and her charting strategy and techniques. Please send an email directly to Helene with your questions. However, please remember that TheStreet.com Top Stocks is not intended to provide personalized investment advice. Email Helene here.
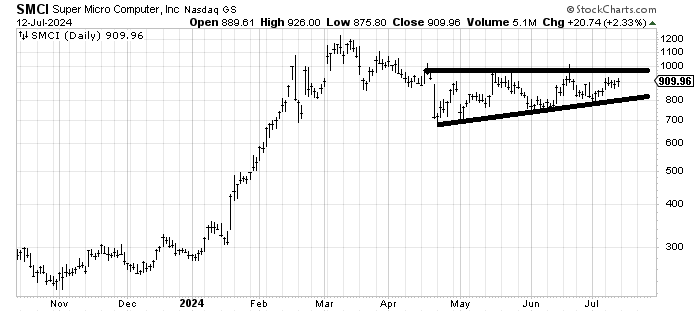
Super Micro Computer SMCI has spent the last 4-5 months correcting so I would think it has another rally in it. Crossing 1000 (far away) should get folks excited once again. The problem is that the stop is so far away too, down under 800.
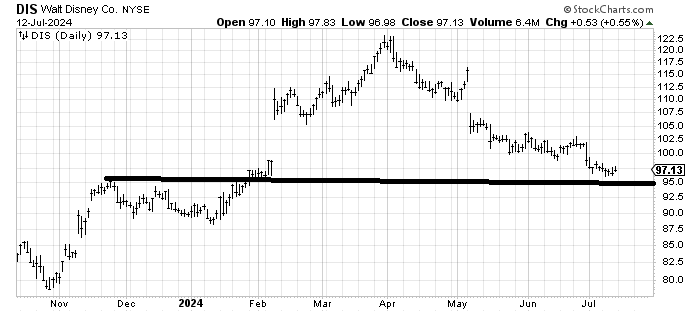
Can Disney DIS rally? I believe we looked at this chart a week ago and I said it has support in this mid 90s area so sure, it can rally. It is oversold. But that resistance at 100-103 makes it just a trade for me now.
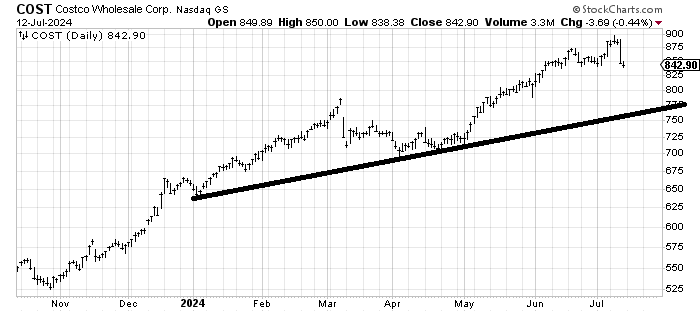
I was asked when will Costco COST be a buy again. I don’t have a good spot yet. We had a good trade back in April when the chart set up (see how it had gone sideways for a few months, thus providing a good set up). We don’t have that now. It looks to me as if that 900 spot is a top for now so I would let the chart come down and form a pattern as it did in the spring before diving back in.