Amazon Prime Video Plans to Add Ads, but Don't Add Amazon to Your Portfolio
The charts of the online giant are casting a bearish hue.
You've reached your free article limit
You've read 0 of 1 free Pro articles.
According to media reports, Amazon Prime Video will introduce ads to its streaming service early next year. This move by the Amazon AMZN unit follows similar actions by streaming rivals Disney DIS , Netflix NFLX and Max WBD .
In my last review of AMZN on Sept. 14 I wrote that traders should raise stops to $136, up from my previous pre-earnings recommendation of stopping out at $123. Traders should have been stopped out of AMZN earlier this week if they followed that advice.
Let's take another look at the charts of Amazon, which is a holding of the Action Alerts PLUS portfolio.
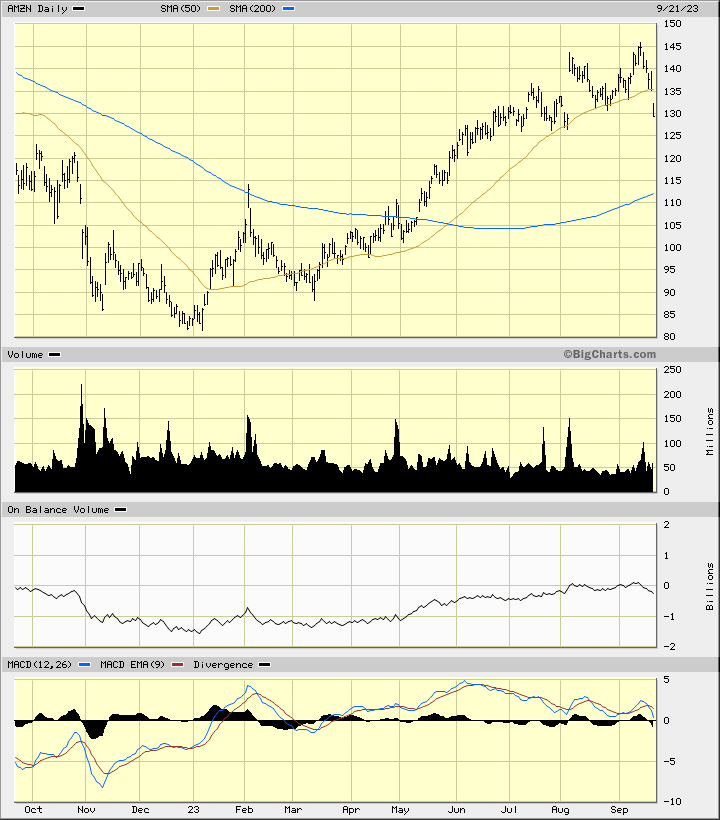
In this daily bar chart of AMZN, below, I see a weak picture. Prices turned lower earlier this month and gapped below the rising 50-day moving average line Thursday and edged below AMZN's late August lows. The On-Balance-Volume (OBV) line has turned lower, suggesting a shift from aggressive buying to aggressive selling. The trend-following Moving Average Convergence Divergence (MACD) oscillator has been correcting since early June and is now only slightly above the zero line.
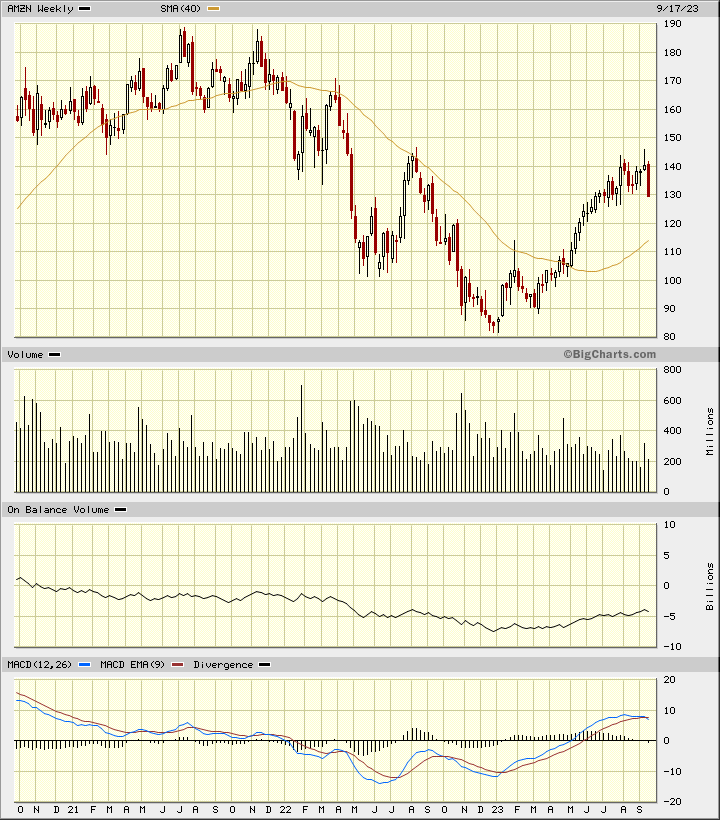
In this weekly Japanese candlestick chart of AMZN, below, I see the two most recent candle patterns are very bearish. First there is a gravestone doji (yes, a gravestone is bearish) followed by a large red (bearish) candle. The trading volume histogram shows us a pattern of shrinking volume for months now and that is not what chart watchers want to see. The weekly OBV line shows a slow, grinding rise this year, but the latest plot is starting to show weakness. The MACD oscillator is crossing to the downside for a take profit sell signal.
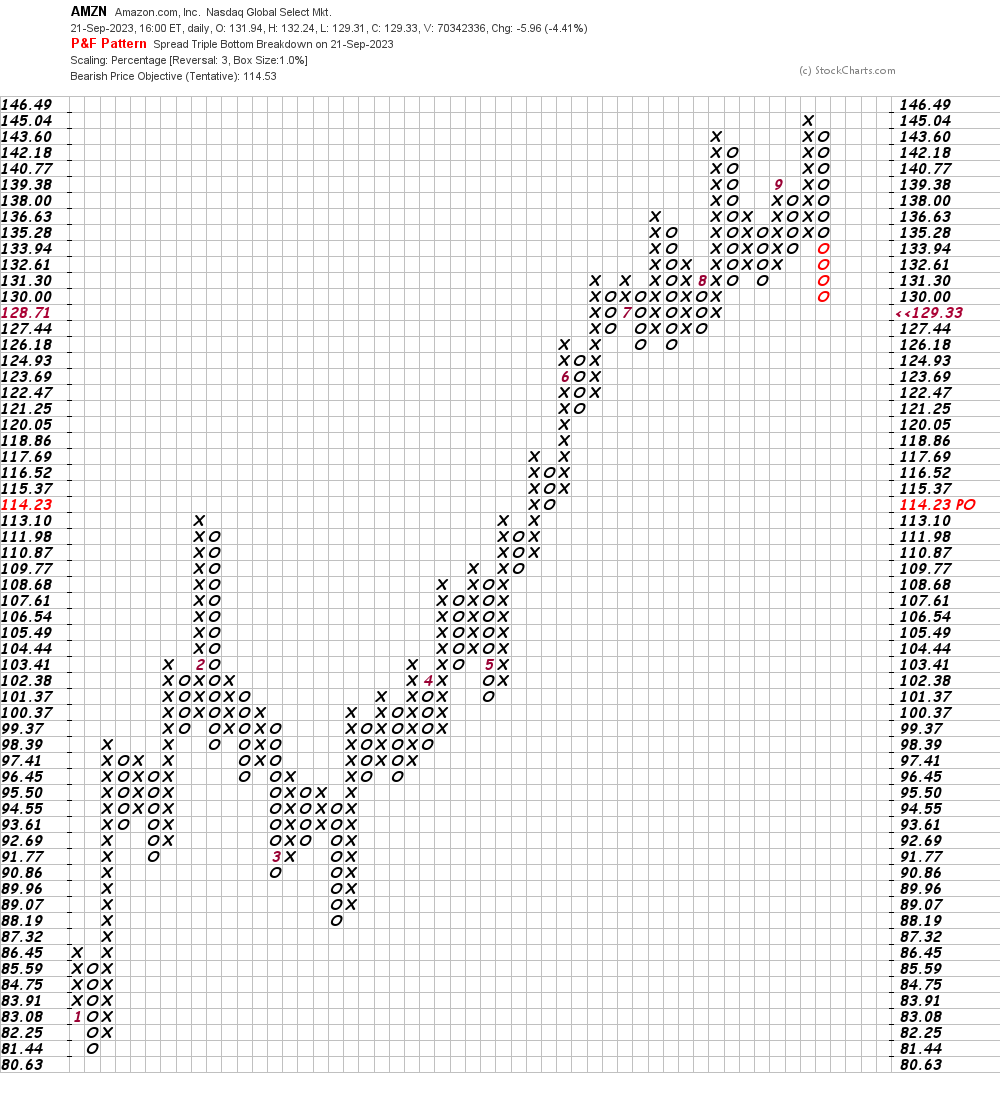
In this daily Point and Figure chart of AMZN, below, I can see a potential downside price target in the $115-$114 area.
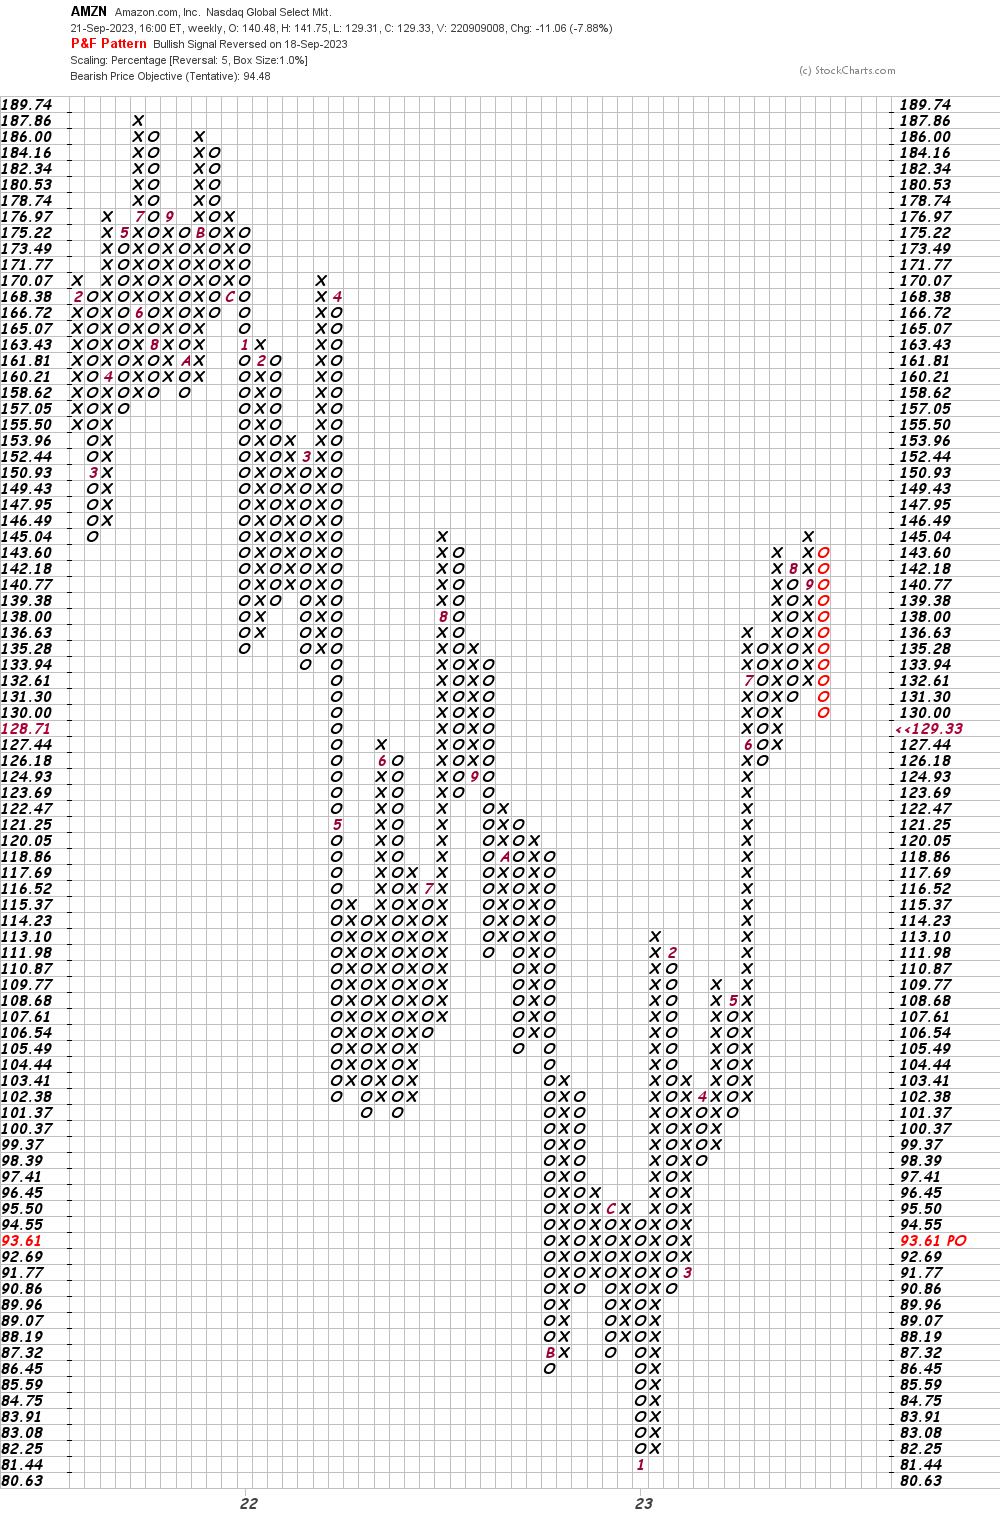
In this weekly Point and Figure chart of AMZN, below, I used a five-box reversal filter. Here the software shows us a price target in the $94 area.
Bottom line strategy: AMZN is trading higher in early activity here on Friday but that action does not do enough to turn the charts above from bearish to bullish. Avoid the long side of AMZN. (BTW, check out this Sept. 1 piece by Real Money's Stephen Guilfoyle for a quick recap at Amazon's third-quarter results and where he saw the stock going at that time.)
(AMZN is a holding of Action Alerts PLUS. Want to be alerted before the portfolio buys or sells these stocks? Learn more now.)
Employees of TheStreet are prohibited from trading individual securities.