Alkami Technology Is Ready to Make New Highs
Here's how high the stock may rise and how to trade it now.
You've reached your free article limit
You've read 0 of 1 free Pro articles.
Alkami Technology ALKT offers digital banking solutions to banks and credit unions. In my February 28 review of ALKT I was anticipating a correction and that is what played out into March and April.
How do the charts look now?
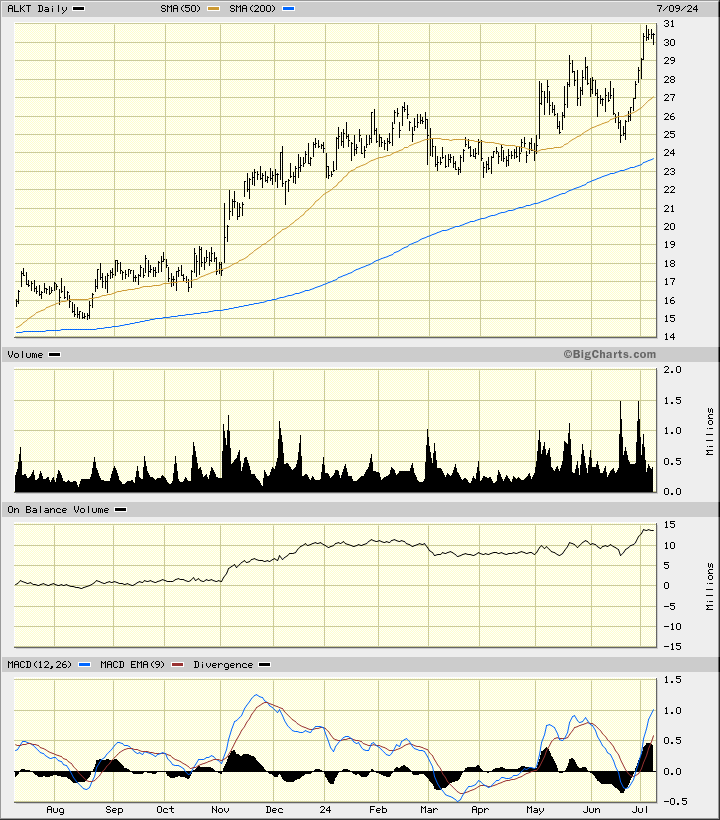
In this updated daily bar chart of ALKT, below, I can see that share prices have rallied sharply in the past two months. Prices trade above the rising 50-day moving average line and above the rising 200-day moving average line.
Trading volume has been noticeably stronger in the past nine weeks. The On-Balance-Volume (OBV) has reached a new high for the move up after a year of positive movement. A strong OBV line tells me that buyers are being more aggressive than sellers. The Moving Average Convergence Divergence (MACD) oscillator is in a positive alignment above the zero line.
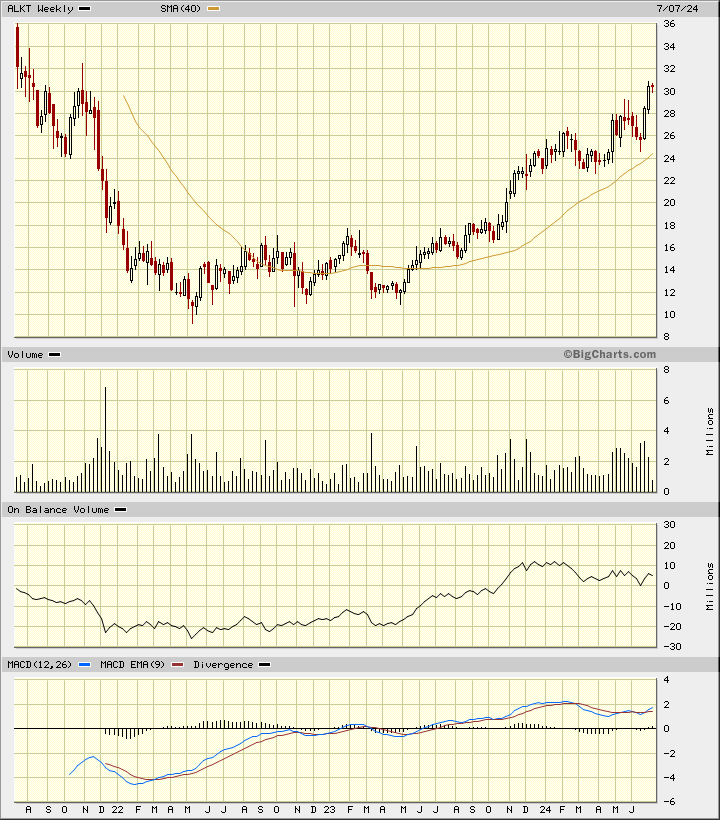
In the weekly Japanese candlestick chart of ALKT, below, I can see the classic decline followed by a base and then a new advance. The shares trade above the rising 40-week moving average line.
The weekly OBV line shows weakness since November. The MACD oscillator is above the zero line and turning higher to a fresh outright buy signal.
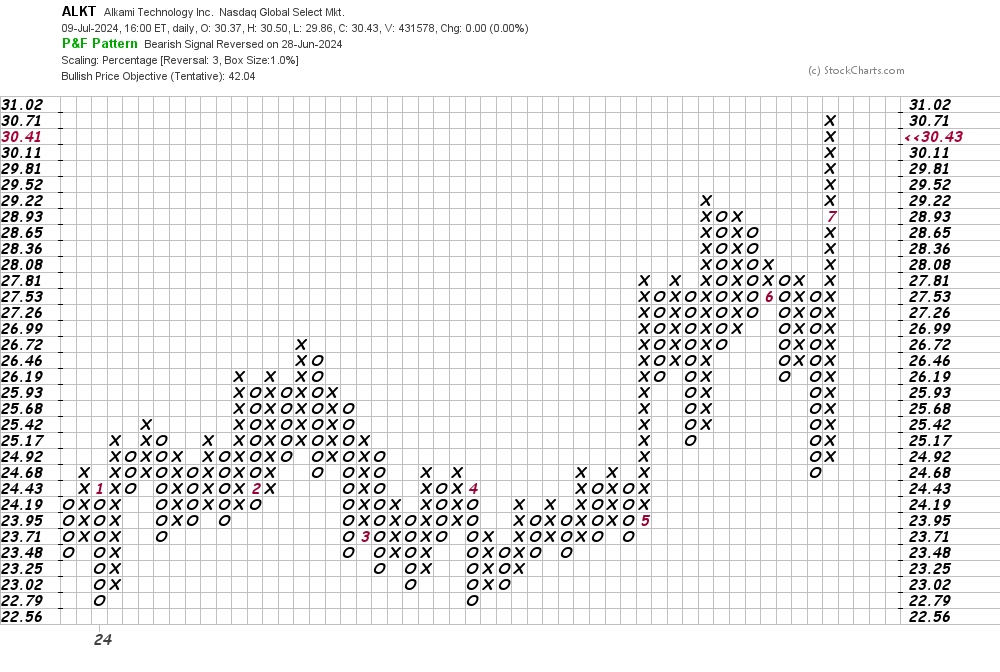
In this daily Point and Figure chart of ALKT, below, I can see an upside price target in the $42 area.
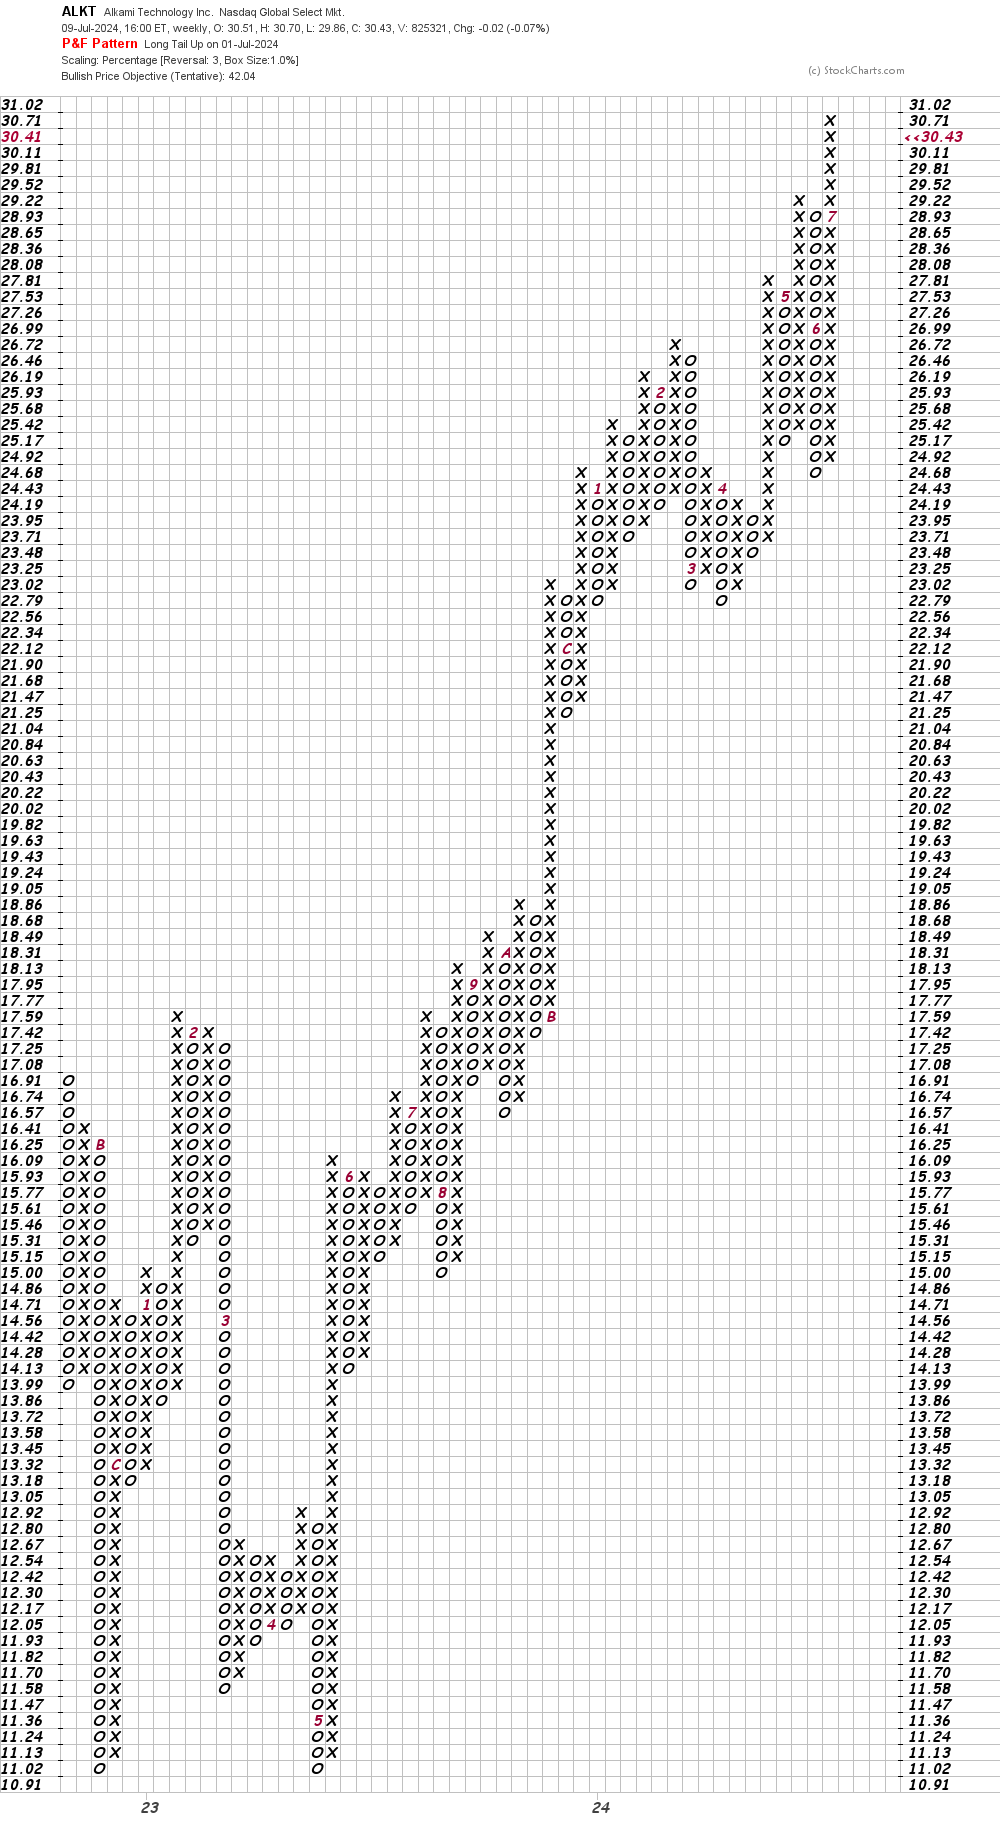
In this second Point and Figure chart of ALKT, below, I can see the same $42 price target.
Bottom-line strategy: Traders could buy any dip towards $29 in the next week or so. Risk to $26. The $42 area is my price objective based on the Point and Figure charts above.
Employees of TheStreet are prohibited from trading individual securities.