After an Ugly Day for the Market, Here's My Biggest Concern
Let's examine Tuesday's ugliness, including volume, the put/call ratio, the S&P and QQQs, and whether there was any panic. Plus a look at heavyweights Nvidia, Tesla and Lilly.
You've reached your free article limit
You've read 0 of 1 free Pro articles.
The Market
Well that was ugly. About the only good news is that the perma bulls got spooked enough to show some concern today.
But the put/call ratio, which we discussed just yesterday as being too low, was 0.79. That is low and it is really low for a day the S&P 500 fell more than 2%.
And considering the decline in the QQQs volume there was only 45 million shares, which shows no panic at all.
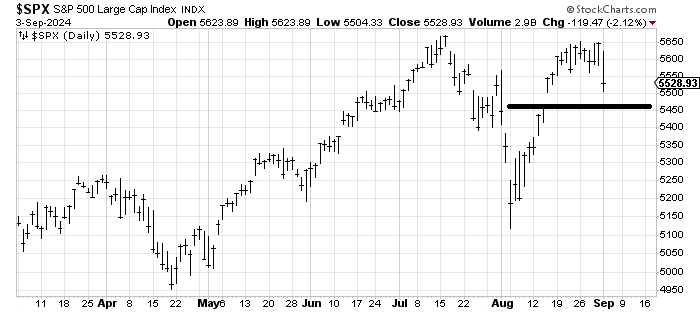
Then there is the gap just below on the QQQs and the S&P. Let’s begin with the S&P. The gap to be filled is around 5455, about 1.5% from here on the downside. That is quite obvious. What is not shown on the chart is that the S&P is now sitting at its 50-day moving average.
Which gives us a bounce? The 50 DMA or the gap fill?
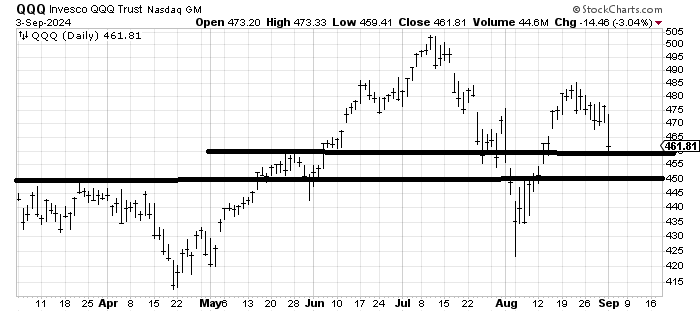
The QQQs, which I thought could bounce (and therefore was dead wrong), did fill a gap at $465 (and then some). There is another one just below $455. But I am eyeing this $455-460 area as the top of support.
Back to sentiment. Only 77% of the volume was on the downside, which shows no panic to go along with the put/call ratio and the light volume for the QQQs. But the biggest concern I have is that stocks fell today on (basically) no news. Usually once the news comes out it’s easier to assess.
I do think the market can/should have a bounce attempt Wednesday but I do not think it can last until we see more panic.
New Ideas
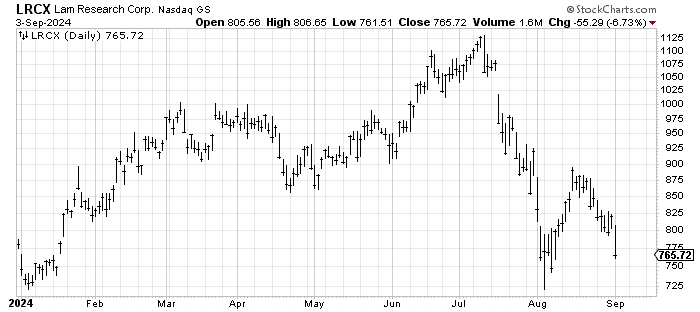
A few weeks ago we discussed how spike lows tend to hold the first time they are tested. It’s the third trip down that is a question mark.
For the next few days I will see if my theory is correct with the chart of Lam Research LRCX. I believe that $725 area will get a bounce the first trip down there.
Today’s Indicators
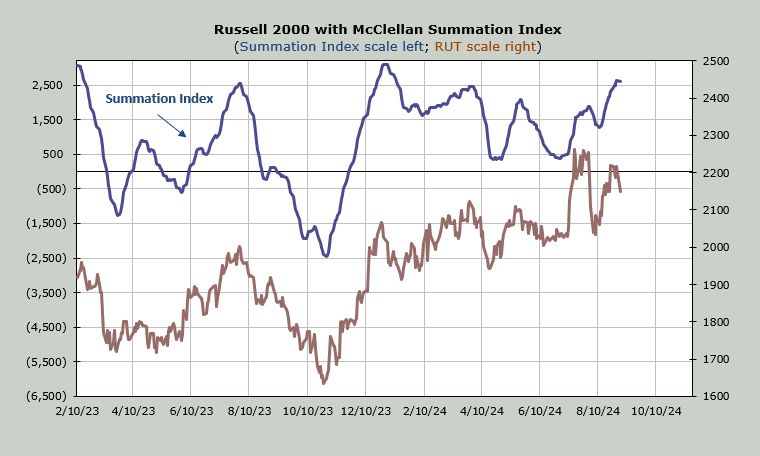
The McClellan Summation Index stopped going up today. Now it needs a net differential of +600 advancers minus decliners on the NYSE to halt the decline.
Q&A/Reader’s Feedback
Helene welcomes your questions about Top Stocks and her charting strategy and techniques. Please send an email directly to Helene with your questions. However, please remember that TheStreet.com Top Stocks is not intended to provide personalized investment advice. Email Helene here.
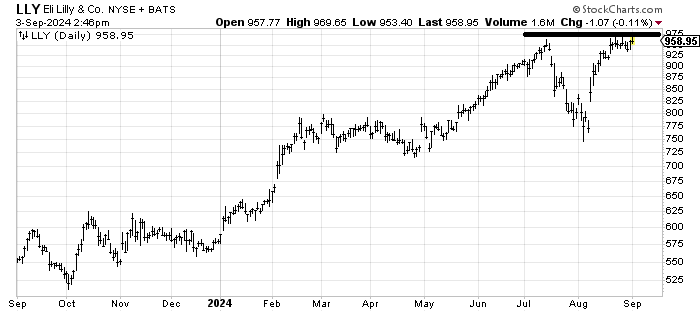
Eli Lilly LLY hasn’t done anything wrong and it might rally again, but for me the setup isn’t there to be bullish on it. The stock has spent too much time at the top of the range. If it rallies over $975 I would not consider it a breakout but rather a reason to take some profits. Take a look at early April. It had a similar situation where it came down (from $800 to $725) then rallied back to $800 and had to come back one more time.
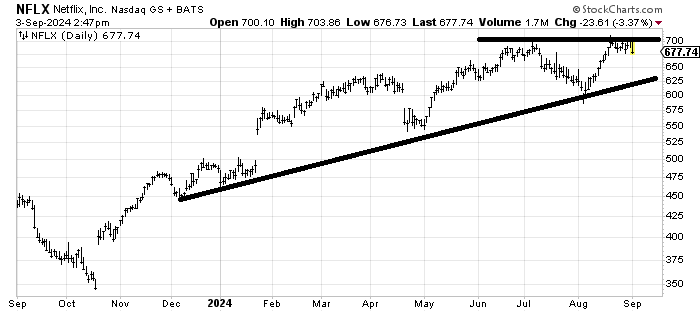
I would guess Netflix NFLX has a similar problem as LLY. It has spent too much time slopping around at the prior high. It may (should) rally one more time but my guess is it is going to tag that uptrend line below in the coming weeks.
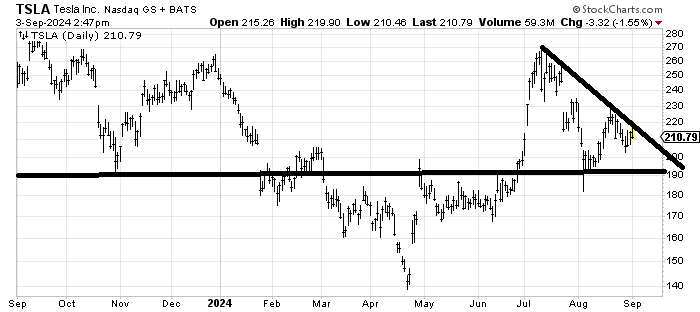
Tesla TSLA is a tough call here. If the market was oversold I would think it crosses that downtrend line handily. But with the market not yet oversold I am more inclined to think it stays in the trading range of $190-225. If it rallies over $220 I’d become more positive on it.