As Vacation Season Draws to a Close, the Buck Wakes Up
The Dollar finally shows some life. So, what does that mean for the market? Let's also look at MSFT, ANF, UNG, TLT, SPIR, GT, and PG.
You've reached your free article limit
You've read 0 of 1 free Pro articles.
The Market
What has changed since I left just over a week ago that is noteworthy in my opinion? The Dollar.
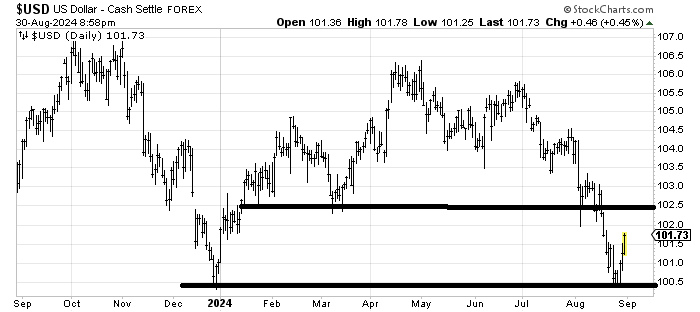
You might recall I fussed over the buck just prior to my vacation. I am still fussing. But this time It is because the bounce off the lows has been dramatic. Take a close look at the chart and notice the five percent move down it had—a move that was relentless—since we entered the third quarter in early July.
Each bounce we had was lethargic at best. But the bounce over the last week is anything but lethargic. And that’s a big change.
Sure there is resistance at 102.50 on the Dollar Index, but that bounce has quite a bit of life to it unlike the other two bounces that have occurred in the last two months.
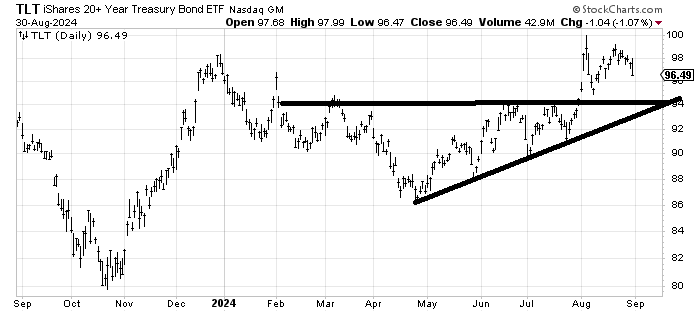
And that goes hand in hand with TLT. I also did not think TLT was going to surpass 100 with that spike high up there and it actually made a lower high (even though Chair Powell’s speech at Jackson Hole got stocks all excited, bonds shrugged). And no one seems to care!
I still think TLT is headed back to that 94 area (about 4.10% on the Ten Year).
What does all of this mean for stocks? I do not know except that the Mega Cap tech stocks have lagged in this rally. And they began lagging in July which tells me they are the stocks that need watching.
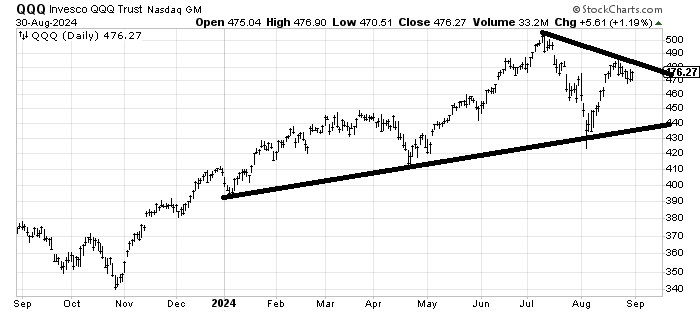
For the first time in what feels like years, it was the QQQs that responded to the overbought condition. It doesn’t look like much but the QQQs fell 15 points during that overbought pullback. So that makes them a little bit oversold, having spent two weeks pulling back. If the QQQs can’t rally this week, I believe it tells us something about the market in terms of if this Great Rotation that began in July is real or not.
And if the QQQs can rally, can they rally over that 485 area that stopped them before?
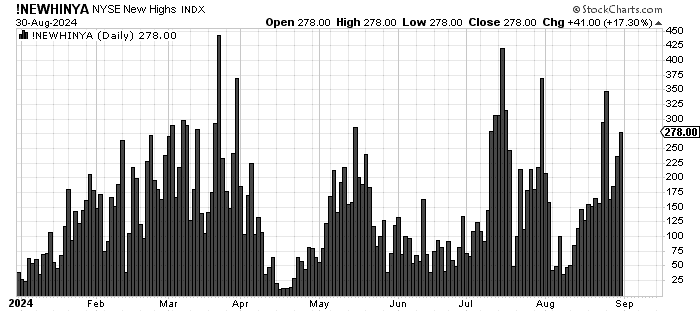
None of the indicators have changed much. Breadth is still good. The new highs still lag and mostly the market remains overbought (ex the Mega Cap tech names).
The only indicator that was extreme was the put/call ratios on Friday. That might have been end of the month type stuff but the total put/call ratio sunk to .73. The Index ratio collapsed to .76 which happens to be the lowest reading since March 5, 2020 just before the Covid Crash. And then there is the ratio for the VIX which fell to .15.
Typically when the VIX put/call ratio goes over 1.0 or under .20 I consider it extreme. We had a reading over 1.0 just before the early August whoosh. There are many who cite the unwinding of that trade as a reason that whoosh was so exacerbated.
We have had five readings of .20 or less this year and four of five brought a round of volatility to the market, with the reading in early April the most prominent when the S&P fell five percent.
So I’m going to focus on the QQQs to see if they can rally.
New Ideas
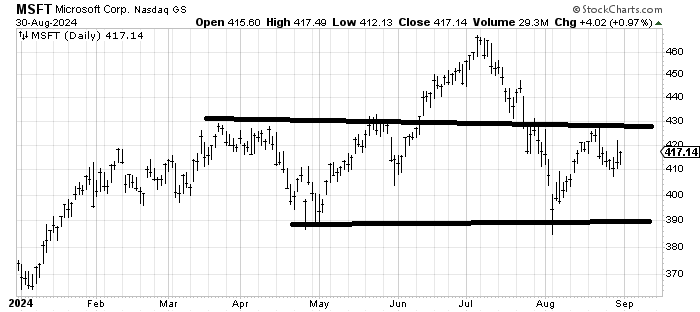
Someone asked me about Microsoft MSFT several weeks ago and I was quite undecided. The stock ran to resistance and pulled back but now I find it interesting. I think it can make a run to resistance again (430). Under 410 and I am clearly wrong. But this goes hand in hand with the QQQ discussion above.
Today’s Indicator
The new highs improved but they still lag.
Q&A/Reader’s Feedback
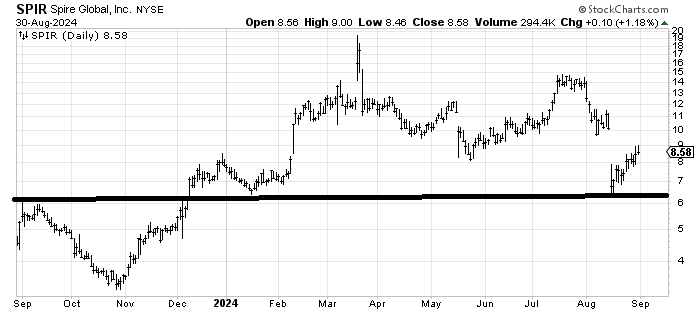
Spire Global SPIR should rally to fill that gap at 10 but that’s the best I can say about it. If it comes back to the 6 area and holds (spike lows tend to hold the first trip down) I might be interested in buying it for a trade.
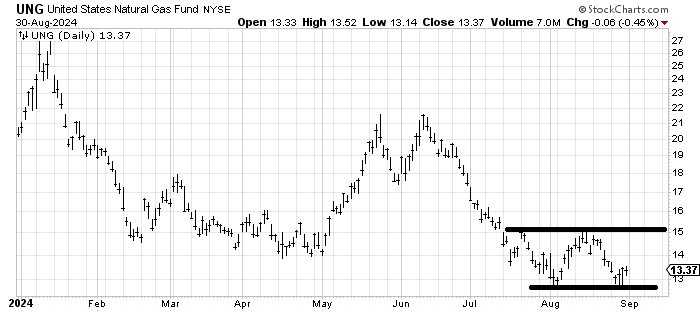
Can we get excited over Natural Gas UNG? It’s got a W pattern and it’s so close to the lows that I suppose the risk/reward is not bad (get out if it cracks under 13) but I think 15 is likely to stop any rally. With the DSI at 45 it doesn’t seem sentiment is overly bearish down here.
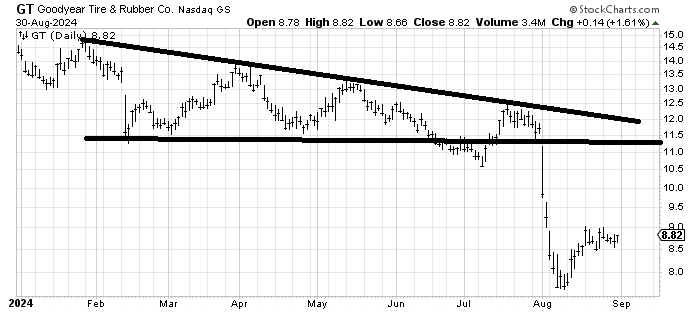
Goodyear GT is a fascinating chart to me. As a bottom fisher I am drawn to it. That plunge in early August to 8 helped it meet its measured target and now it has spent the last two weeks going sideways so a move over 9 could/should get it going again. I would prefer to see it stay over 8.50.
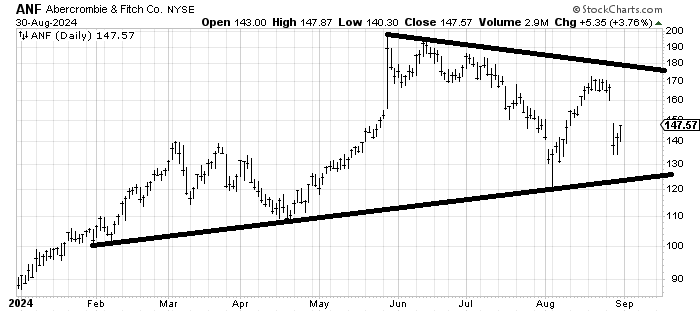
Abercrombie and Fitch ANF is the perfect example of why the number of stocks making new highs lags: it hasn’t made a new high since May. Right now I’d be inclined to sell a rally to 160-170 on a gap fill.
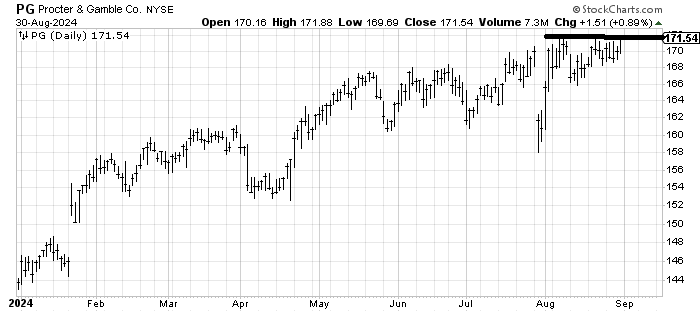
I was asked for an upside target for Procter and Gamble PG which I recommended months ago and has been a rather lethargic stock, despite so many defensive names (staples) doing so well. In any event, over 172 and it measures to 175-178.