After 8 Straight Green Days, Is the Market Overbought?
Let’s look at key indicators to see when momentum begins to decline.
You've reached your free article limit
You've read 0 of 1 free Pro articles.

The Market
You know what’s so amazing? Okay, it’s anecdotal, but there is so much movement in so many individual stocks that I do not see a soul noting that the S&P has been green for eight straight days. You know that’s unusual, don’t you?
Folks are so wrapped up in the moves—and how can you not be?—they have taken their eye off what they normally would chatter about. Oh, and yes, Nasdaq has been green for eight straight days as well.
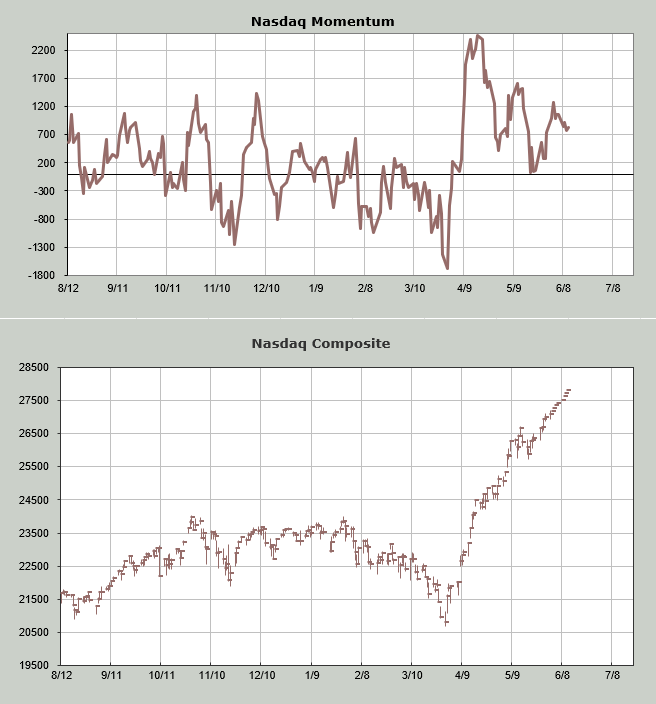
Yesterday we looked at the Russell Momentum Indicator and saw it peaks on June 2nd. Nasdaq’s is not much different. It too peaks tomorrow. As a reminder, we are not looking for the exact day/date, just the general time frame, and I maintain we should see a pullback this week.
My own Overbought/Oversold Oscillator ought to be overbought midweek this week as well. The McClellan Summation Index ticked up a bit last week, but it stalled out today, so it won’t take much to push this back to the downside.
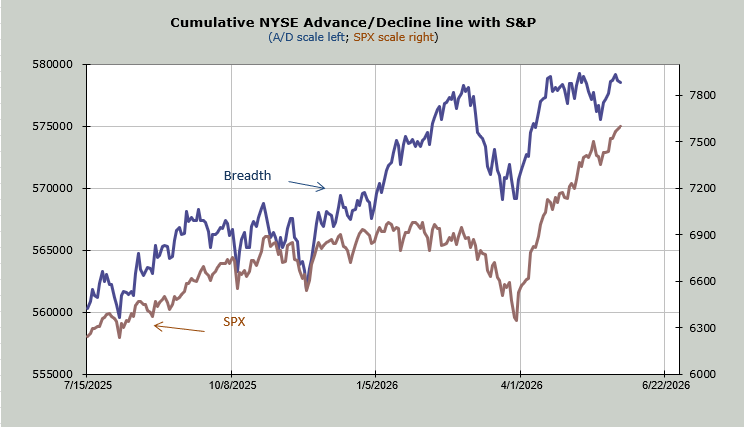
Look at the chart of Breadth, and you can see the fact that it cannot make a higher high while the S&P powers onward, which is a divergence.
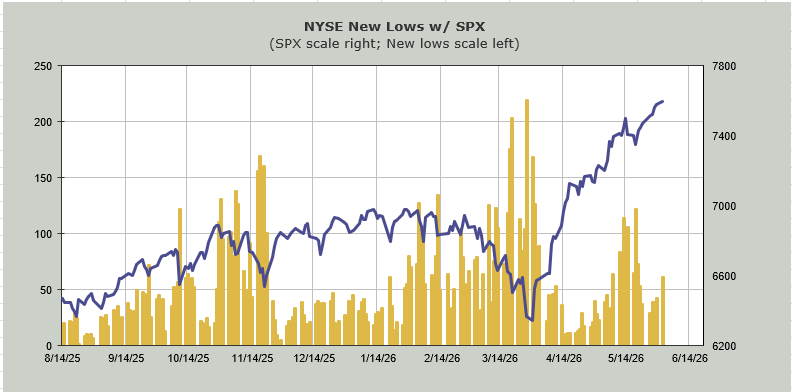
Just look at the number of stocks making new highs on the NYSE. We can’t even get this over 200. And today was fewer than last week. There are over 3000 issues that trade on the NYSE daily, and only 100 are at new highs.
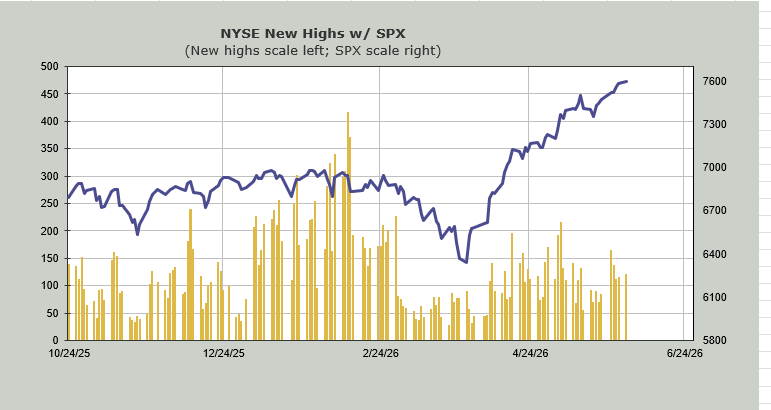
Now look at the chart of stocks making new lows. While you cannot see an uptick in new highs, you can see the uptick in new lows, although they are still fewer than when we got oversold two weeks ago. But the S&P keeps ramping upward on fewer new highs and more new lows.
Statistically, sentiment hasn’t changed. Anecdotally, though, everyone seems to have a reason to buy tech now. No talk of broadening out. Now it’s all, well, that would be nice, but we don’t need it.
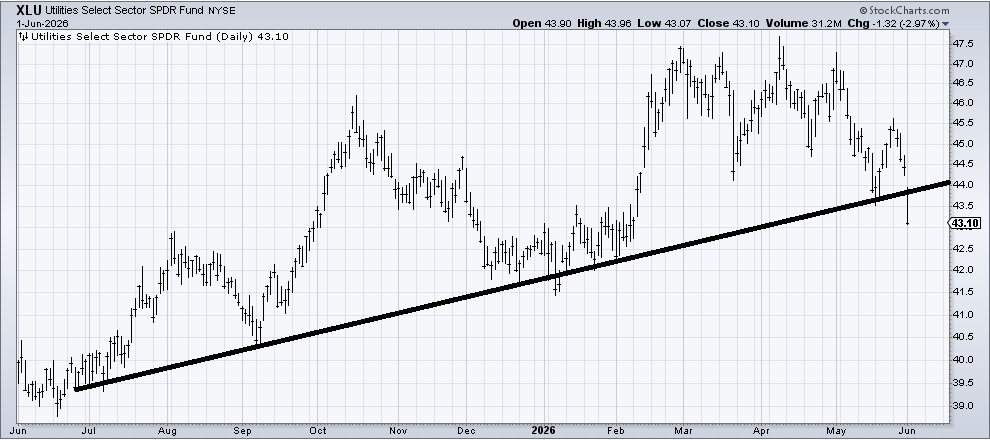
Then there are the Utes. They were doing so well and then wham! They have crapped out in three days. I don’t love that they broke the uptrend line. But there is a lot of support on XLU in the 42-43 area, so I’m not ready to count them out. But if they cannot recapture that line in a hurry, it will go on the bearish side of the ledger.
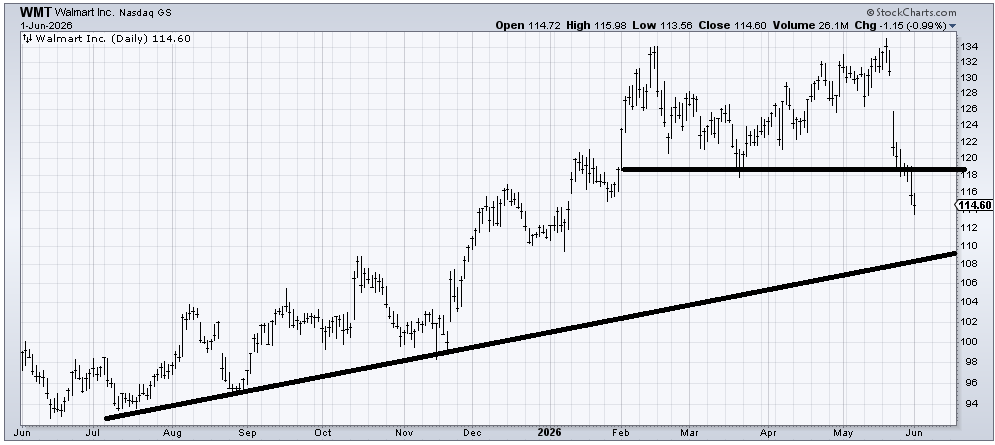
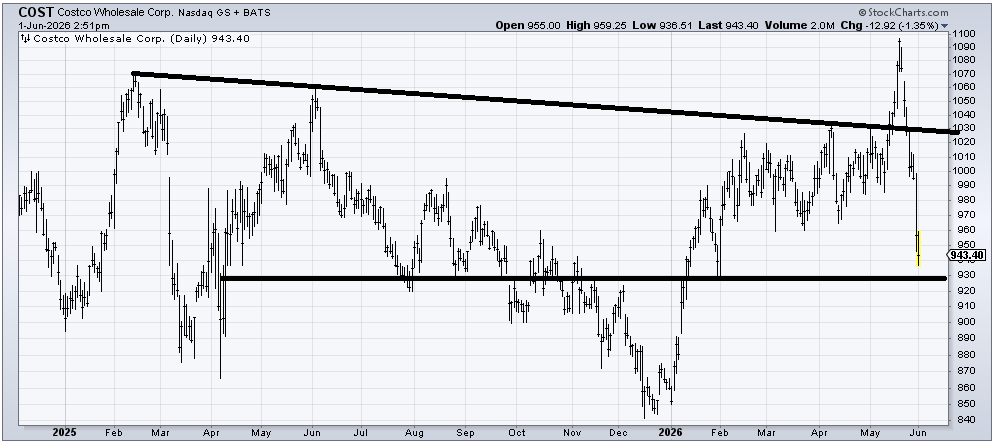
Below you will see a discussion on Costco, which went from a new high to near collapse in a matter of days. Or what about Walmart, which has fallen over 15% in a matter of days. Sure, I have been cautious on this chart, but there has been no bounce in eight or nine days, yet the S&P has been green every one of those days.
The stock is getting oversold in the short term, but that is a double top it broke down from, the same way Microsoft broke down late last year. But who cares about Walmart when Dell rallies by 30% every day?
New Ideas
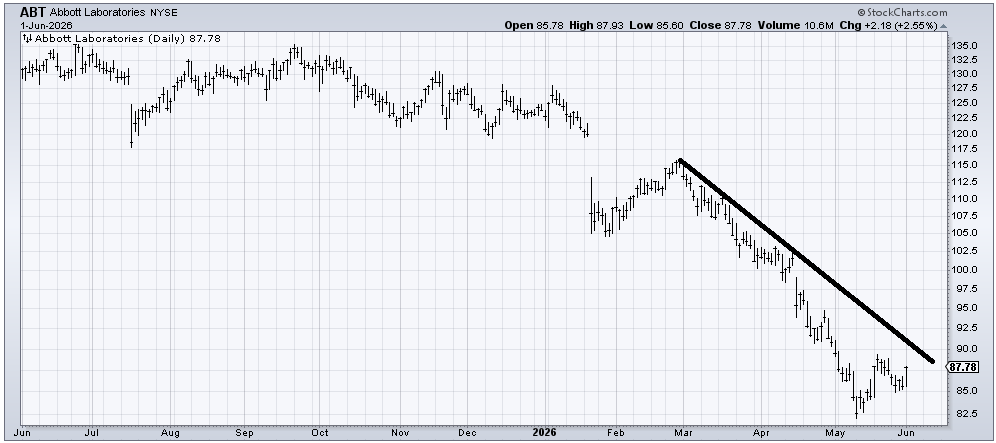
I promised to keep following up on Abbott Labs (ABT), and I continue to think it can rally to at least 90 and maybe even cross that downtrend line.
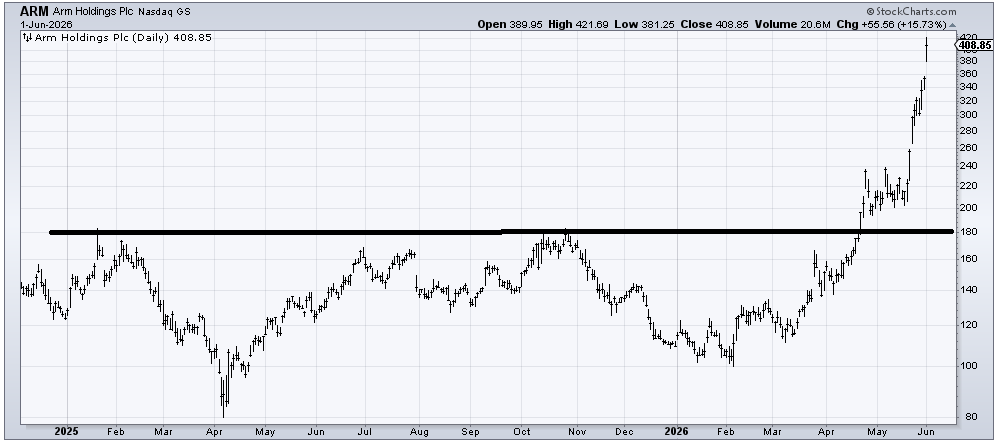
I recommended Arm (ARM) a few months ago because of that big, giant base. The stock hasn’t done a thing wrong, but the action in the last week or so is screaming that it is time to at least take a little something off the table. Should the stock gap down under 380 and leave today as an island, that would be a negative.
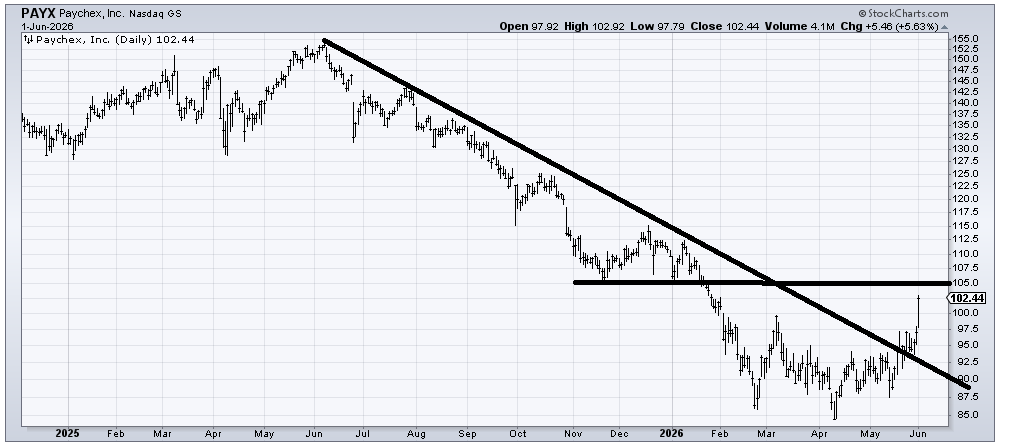
I recommended Paychex (PAYX) last week, and it had quite a day today, considering it is not a tech stock! It did cross the downtrend line, but I do want to point out that this week, the Employment numbers are out, and they could affect the stock the way earnings might. There is decent resistance in this 105 area.
Today’s Indicator
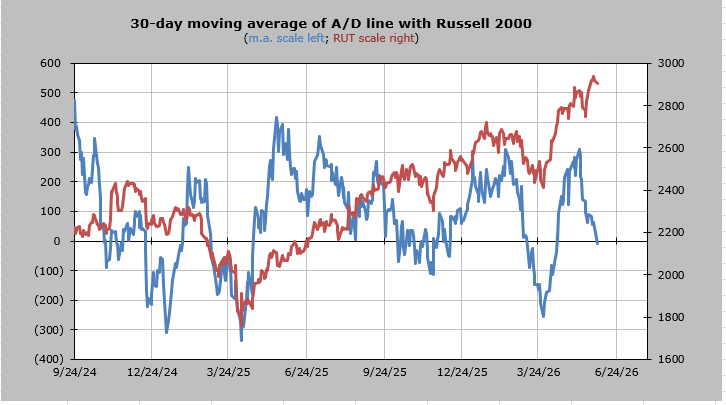
The 30-day moving average of the advance/decline line has been trending down for three weeks now. That tells us the average stock has mostly been doing that as well. I will report when it gets oversold again. A good whack this week might get us there by next week.
Q&A/Reader’s Feedback
Helene welcomes your questions about Top Stocks and her charting strategy and techniques. Please send an email directly to Helene with your questions. However, please remember that TheStreet.com Top Stocks is not intended to provide personalized investment advice. Email Helene here.
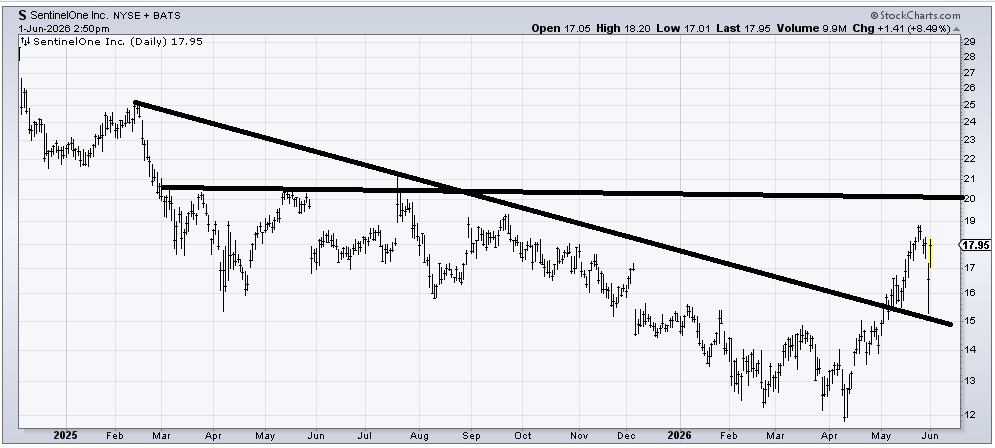
SentinelOne (S) might be trying to base, but that move over the last week is disconcerting. The stock has a history of being much more steady, not volatile. That having been said, my initial thought is that the resistance in the 20-21 area is going to be tough the first time up, despite the stock trying to form a base. So it might trade up there, but my sense is it is not set to break out just yet.
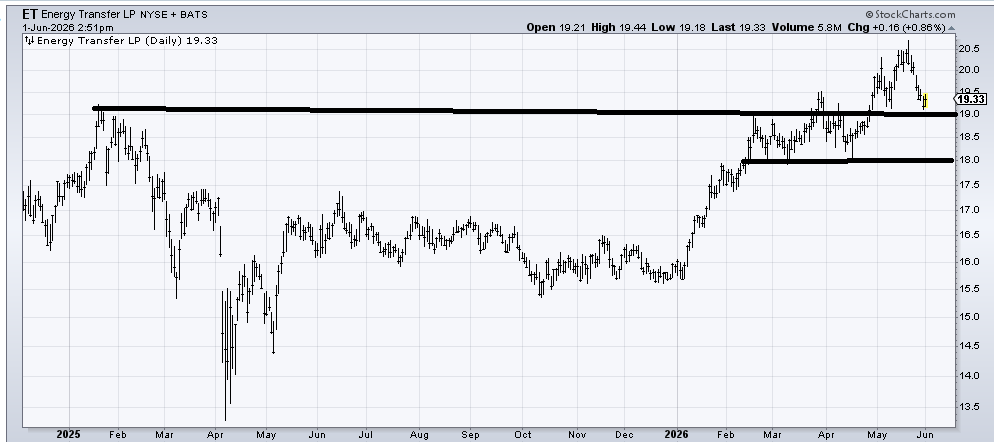
Energy Transfer (ET) has a lot of support in the 18-19 area. I think it needs some time, but I suspect that will turn out to be a decent area to buy some. Under 18 and I am wrong.
Some of the moves in these single stock names are breathtaking, and Costco (COST) is right there in that group. I thought it would break out over 1030, but I also thought 1030 would hold on a pullback. Boy, was I wrong.
The stock is getting quite oversold in this general support area, so I’d start looking for an oversold rally by the end of this week.
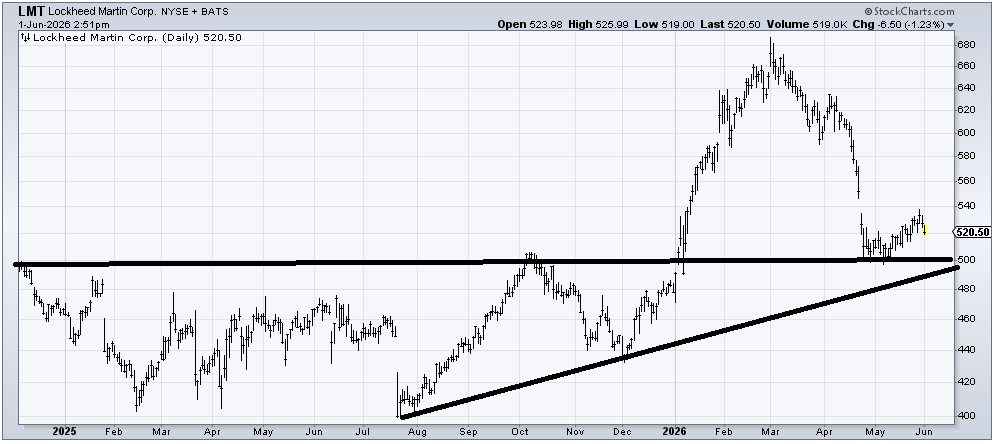
Lockheed Martin (LMT) had a nice bounce off support. Now I think it should come back and retest that area where the lines are (call it 480-500) where I think there is a chance it forms a W. If it gets back down there, be sure to nudge me again.
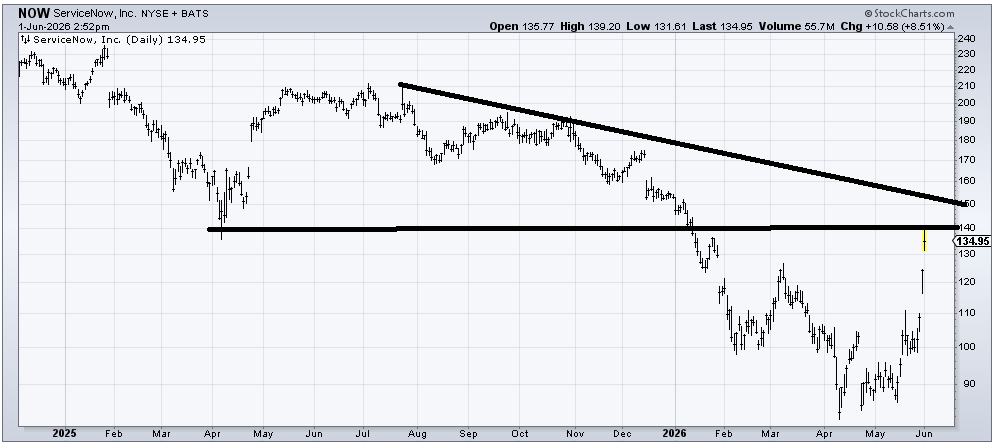
The move in Service Now (NOW) has been explosive, like so many software names (more single stock volatility). But it is now into the lower end of resistance. I would think the 140-150 area is where it runs into short-term trouble. Should it set up a new pattern, I would get interested, but right here, up 40%+ in a couple of weeks, I am not chasing it.