Abbott Labs Slumps on Baby Formula Verdict, But Can It Pass the Test?
The $100 area is key for this healthcare stock.
You've reached your free article limit
You've read 0 of 1 free Pro articles.
Shares of Abbott Laboratories ABT are falling Monday after a jury awarded the plaintiff $495 million in damages in a baby formula case. An appeal is likely but what risks do the charts suggest at this point?
Let's check.
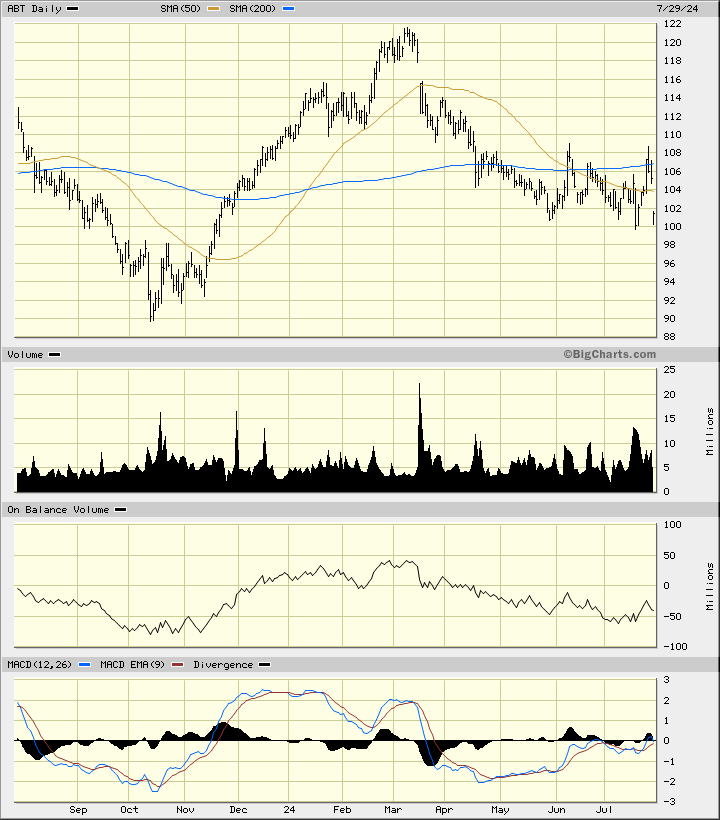
In the daily bar chart of ABT, below, I can see that the shares gapped lower from a peak in early March. ABT declined into a low in July and that low is being retested Monday. A close below this low could open the way to further declines. I cannot rule out a rebound from the $100 area. The shares are trading below the 50-day line and the 200-day line this Monday morning.
The On-Balance-Volume (OBV) line shows weakness since March and tells me that sellers of ABT have been more aggressive than buyers. The Moving Average Convergence Divergence (MACD) oscillator is below the zero line.
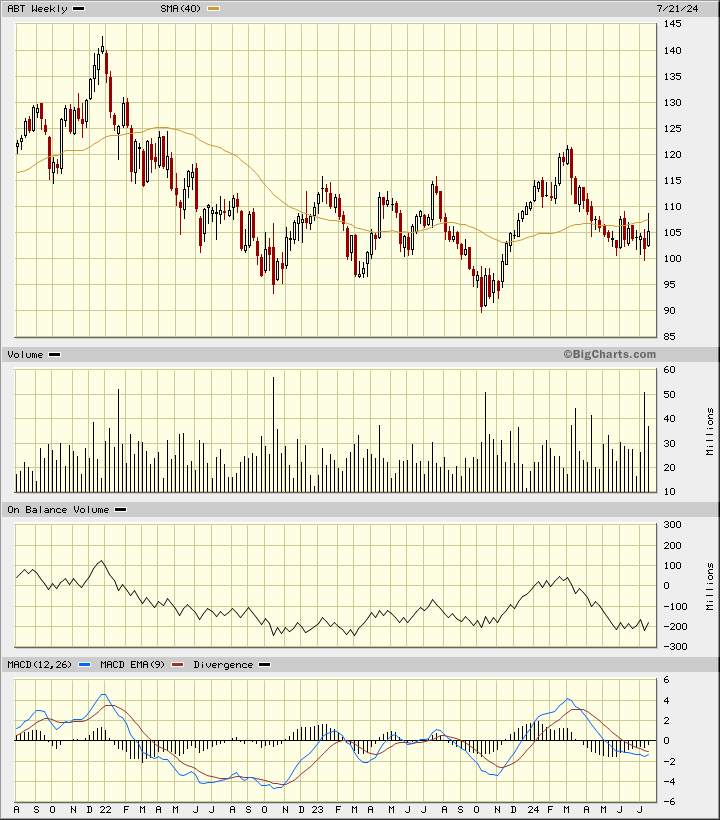
In the weekly Japanese candlestick chart of ABT, below, I can see a chart that looks vulnerable to further declines. The shares show an upper shadow at the underside of the 40-week moving average line.
The weekly OBV line has been weak since March and the MACD oscillator is bearish.
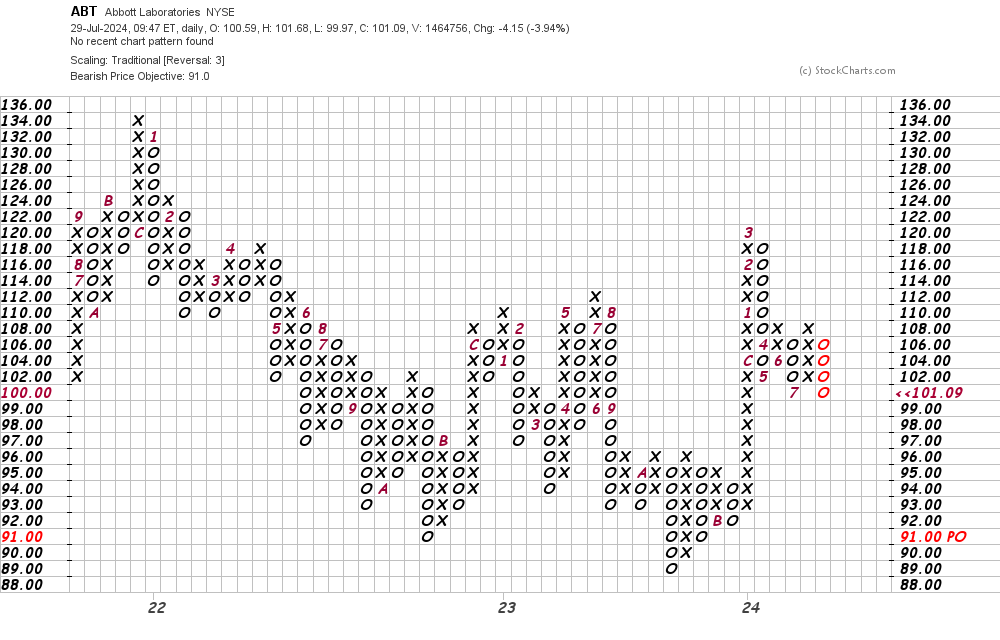
In this daily Point and Figure chart of ABT, below, I can see a downside price target being projected to the $91 area.
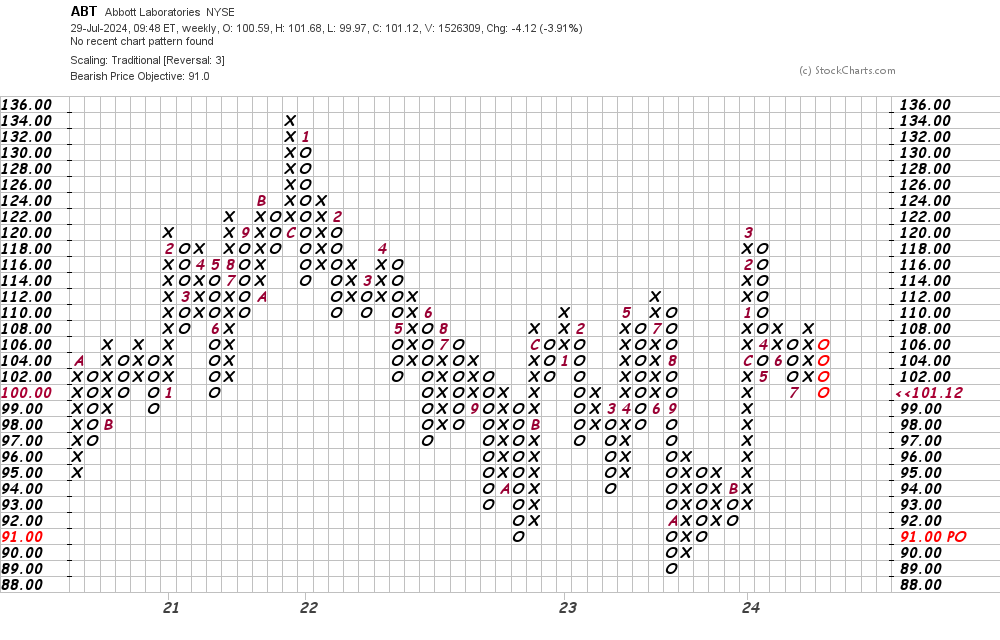
In the weekly Point and Figure chart of ABT, below, I can see the same $91 price target. A decline to $91 would mean a retest of the October low and traders will need to watch that area more closely.
Bottom-line strategy: ABT may hold the $100 area and rebound but I don't give it high odds at the moment.
Employees of TheStreet are prohibited from trading individual securities.