A Tough Day for Stocks, Forecasted by the Indicators
Stocks catch up to what the indicators have been saying. Let's also look at BMY. QCOM, TLT, LYB, META, ABBV.
You've reached your free article limit
You've read 0 of 1 free Pro articles.
The Market
Well, we finally got the move in the indexes where they play catch up to the indicators. We’ve got the Dow under the 50-day moving average. We have the S&P right at it, and we have the SOX toying with the 200-dma.
As long-time readers know, I don’t usually fuss over levels unless it is a well-watched level that everyone seems to think is important. So, what I am focused on now is that the intermediate-term indicators are not oversold. As noted yesterday, the Volume Indicator was closest at 51%. Today it is 49%. Typically it must get to at least 47% to get oversold. But at least it is closer than it was two weeks ago when it was 55%.
But let’s move to the shorter term for now. My own Oscillator is oversold. Is it great? No. The math behind it is okay, not great. So now we turn to what it will take to get the McClellan Summation Index to halt the decline. It needs +3100 advancers minus decliners on the NYSE. We have been milling around this +3100 for the better part of a week, and it hasn’t mattered. An extreme reading is over +4000. A down day tomorrow, and we could get there early next week.
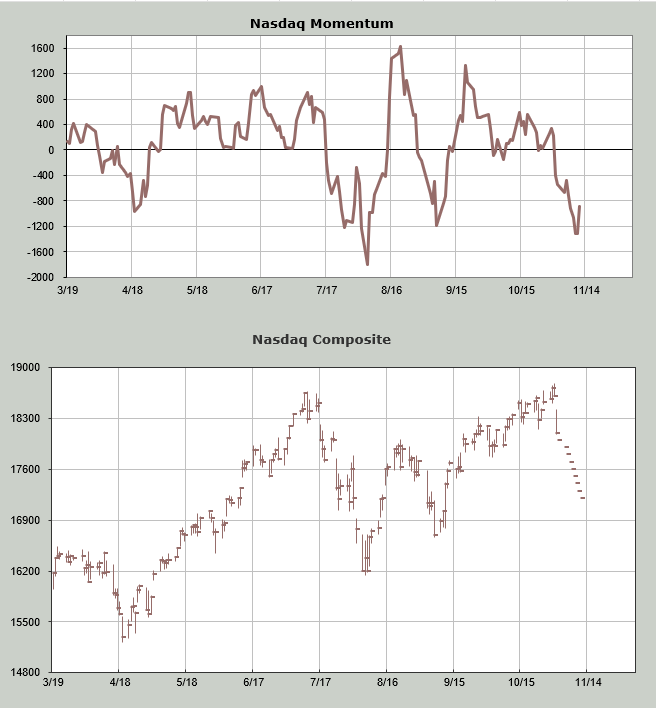
Then, there is the Nasdaq Momentum Indicator. What I do here is plug in lower closes for Nasdaq over the course of the next week or so until I get to the point where lower closes don’t matter anymore and the indicator turns upward. The date is not exact but it’s a guide.
If I walk Nasdaq down 1000 points over the next ten trading days, I find that it gets oversold, using this method, on or about November 9th.
I did not sense much panic in the market today. In fact it felt like folks were rather ho-hum about the rally. The put/call ratio got to 1.0. The VIX is starting to get jumpy.
I don’t know if the market will be up on Friday (first day of the new month and the Employment number), but I have defined the parameters I will look for in the next few weeks, and that starts with getting to a good short term oversold reading and a little more fear in the market.
New Ideas
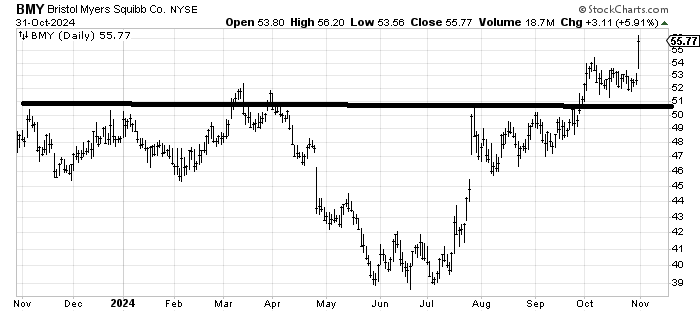
We may as well start with Bristol Myers BMY which finally rewarded our patience and broke out on earnings today. The measured target is in the mid 60s although if you wanted to take a few profits here I wouldn’t argue too loudly since the stock is up 40% since July.
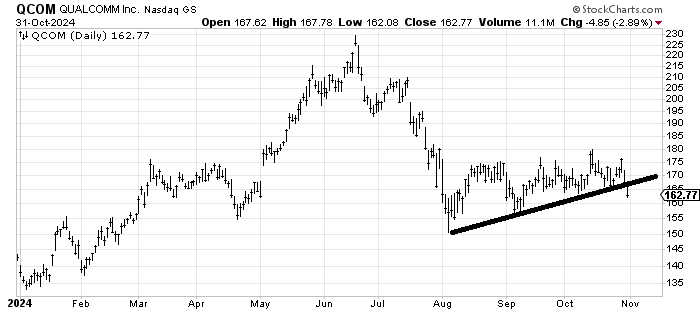
Then there is Qualcomm QCOM which last week I finally decided was okay as long as it held that uptrend line. It had a nice bounce off it and then come right back down and broke it. It’s got support down here , all the way to 155-ish but that’s a break and I’m wrong.
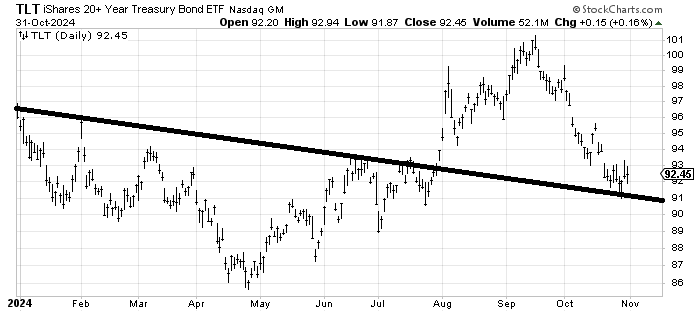
Finally there is TLT which has been doing a lot of milling around in the last week or so. I still think it’s going to try and bottom here. The Employment number tomorrow will probably move it. I would like to see it hold 91.
Today’s Indicator
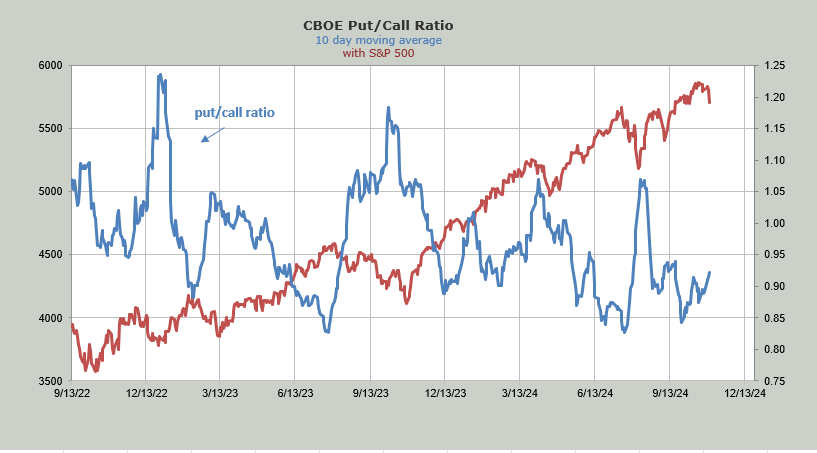
The ten day moving average of the put/call ratio is heading upward. A move up to that 1.05 area would be bullish.
Q&A/Reader’s Feedback
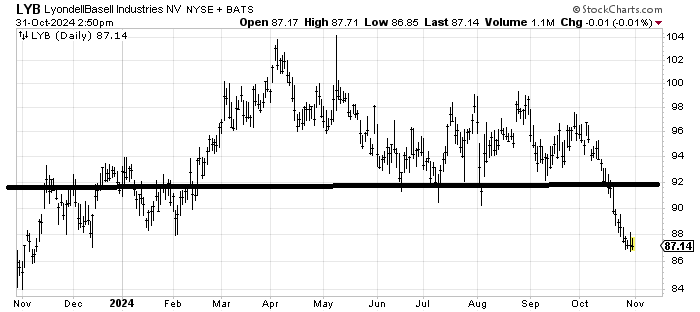
It’s possible the selling in Lyondell LYB is tax loss related but if I do a measured target I get something closer to 85-ish. And then there is that resistance that is left overhead. If you got a pop to 90-ish I’d be a seller.
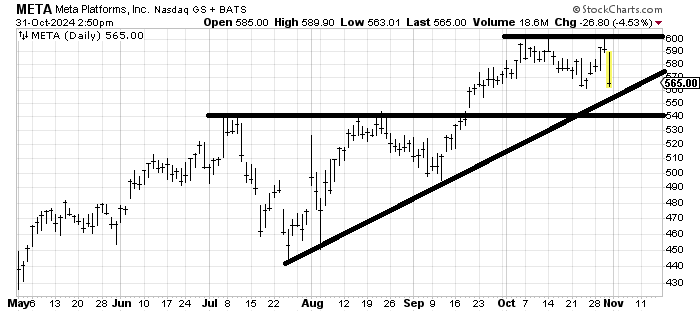
I guess the good news is that Meta META hasn’t broken last week’s low nor has it broken the uptrend line. If it does break 555-ish then 540 is the next support. I am not a buyer yet.
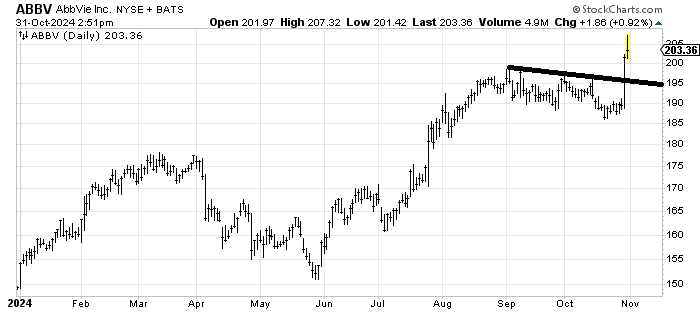
AbbVie ABBV has a measured target from that latest consolidation around 205 which it got to today. I’d be inclined to take some profits or wait until it restests 195 to be a buyer.