A Rally, But Only for the Select Few
Flat breadth, while money came back into the stocks nobody wanted just yesterday.
You've reached your free article limit
You've read 0 of 1 free Pro articles.
The Market
Did you notice something about the rally today? It was concentrated in the index movers—the QQQs in particular. This is exactly the reason I thought that’s where our focus should be. And the SOX.
Why? Because when no one seemingly wants these stocks, that’s when they tend to be the best trade.
And how do we know today’s rally was concentrated in the index movers? Because breadth was terrible. It was basically flat. And that means there was very little change in the indicators. In fact, if you look at the Overbought/Oversold Oscillator, you will see that the S&P has now rallied two straight days and almost one hundred points and the Oscillator keeps heading down. That’s because the Oscillator is based on breadth, and while today was the first truly poor breadth day, breadth has been mostly sideways for the last two weeks.
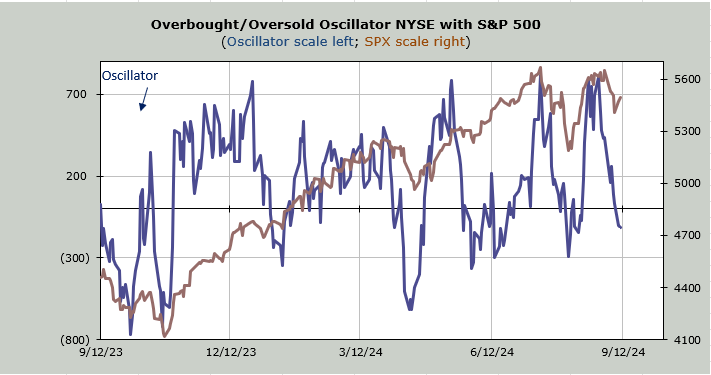
Now, the good news is that the Russell tried to go down and managed to come back to flat for the day. The bad news is that the S&P was up 24 points, with a mere 39% of the volume on the upside. That is how you get a rally with negative divergences.
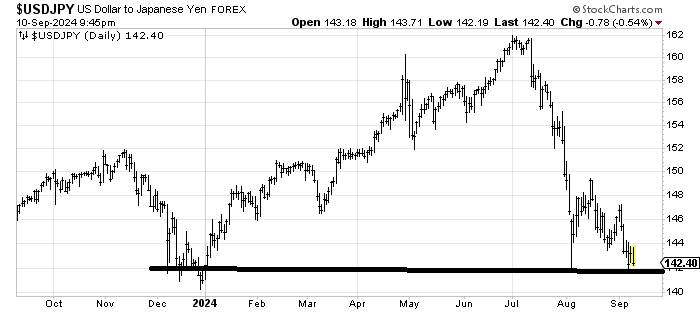
As you know, I have been harping away about the buck, and so, while the Dollar Index is shuffling upward, The Dollar vs the Yen is pushing up against that 142 level that held in early August.
No one talks about it anymore, but I think we should put it on our screen because it might just be what the market has taken its eyes off of.
Finally, I just want to note that regarding oil, it is odd for a storm to hit the Gulf and shut down production and oil goes down, and not just a little. It’s probably getting oversold in the short term but the DSI is still 45 so if you’re looking for a great buying opportunity, the DSI is not on your side.
New Ideas
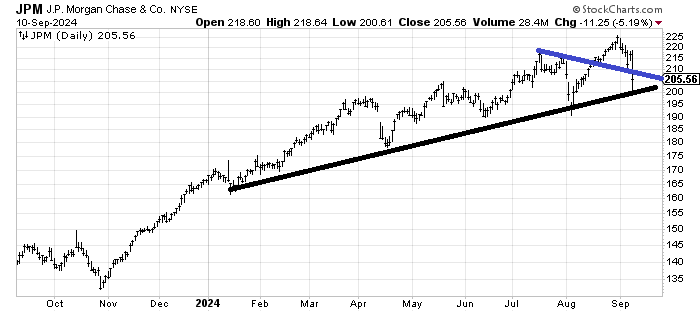
Let’s talk about JP Morgan JPM. Last week when the stock was still around 220 I drew in that blue line and said I thought it should come down there. If you squint, you can see it did just that on Friday and Monday it bounced. But today, that bounce was short-lived and it came down to that black uptrend line.
It ought to bounce from here, but I think it was in a much stronger position had it held the blue line. I’m not convinced this is it for the correction in it.
Today’s Indicator
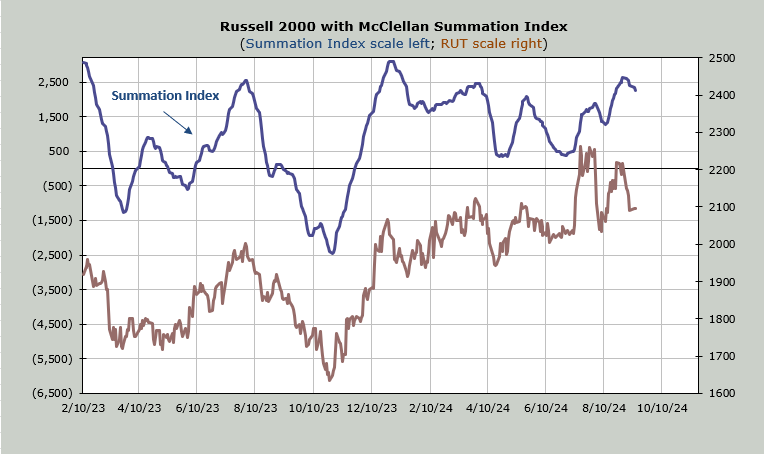
The McClellan Summation Index is still heading down and today’s breadth readings didn’t help. It now needs +1500 advancers minus decliners to halt the decline.
Q&A/Reader’s Feedback
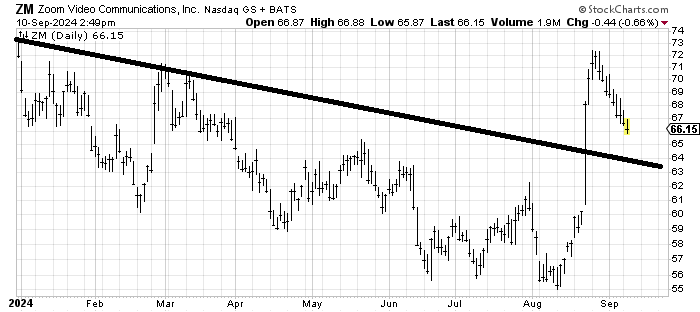
In the last few months it has not been a great idea to buy the pullback after a stock has zoomed upward (see IWM in July). I would say Zoom Video ZM is probably not any different. But if the stock can tag that line around 64-ish I would expect a bounce from it.
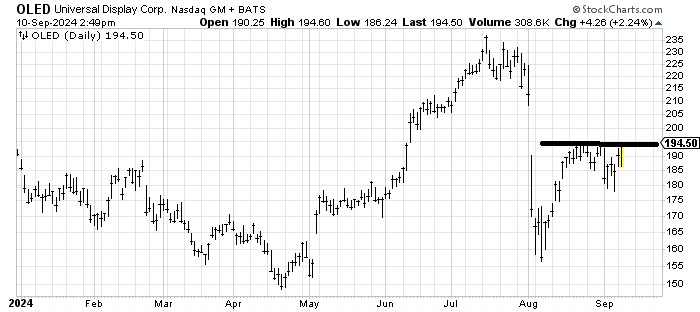
Universal Display OLED has resistance here at 195. If it gets through, I would expect it to fill that gap in the 208 area.
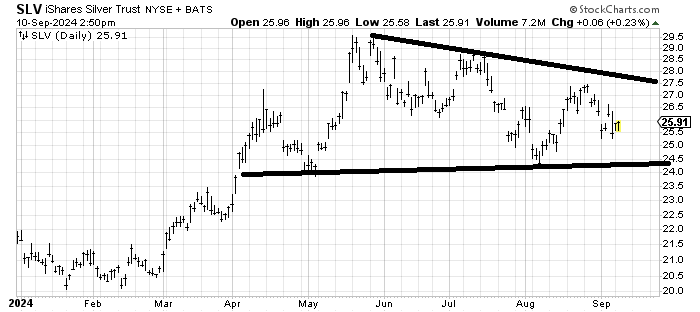
I don’t really know what to do with the iShares Silver ETF SLV. It’s been bouncing in the range of 24-28/29 since April and at 26 that puts it in the middle of the range. I’m more inclined to think it tags that upper line than the lower line but mostly it is a coin toss here.