A Minor Divergence in Breadth. Can It Heal Itself?
What impact has the recent chop had on the indicators? Let's look at it as well as IWM, MO, NKE, GILD, LVS, AMT, and SWK.
You've reached your free article limit
You've read 0 of 1 free Pro articles.
The Market
Another day of rallying, and there is still no change in the indicators. And another day that breadth wasn’t very impressive. Let me show you what I’m focusing on.
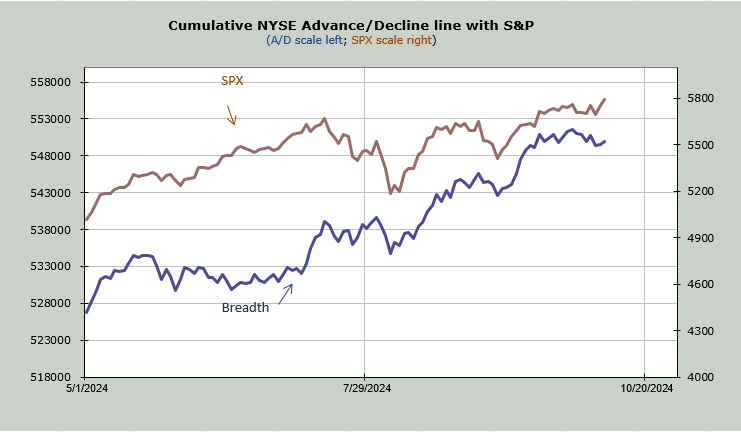
For weeks—months really—I have been noting that breadth has been good. That’s the blue line. You see the way it surged to a higher high weeks ago and the S&P sat there? But since this chop started, and then the last few days of rallying, notice the brown line (S&P) has lifted while breadth has sagged. That’s different.
Right now the change is minor, but it is worth paying attention to since the McClellan Summation Index is still heading down and still needs a net differential of +1900 advancers minus decliners to halt the decline.
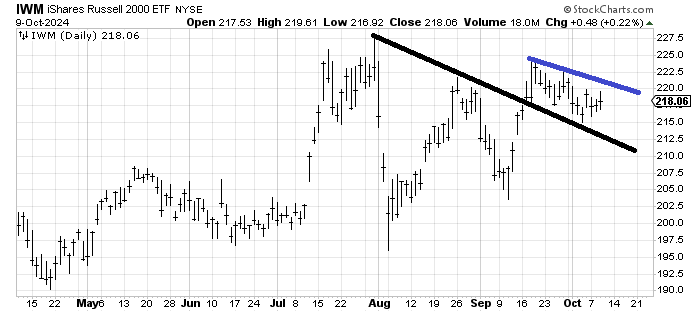
It is possible that breadth can ‘right’ itself. The Russell is still a bit oversold. And IWM did tag that 215 level that we discussed last week. So if the Russell can get going then breadth ought to improve.
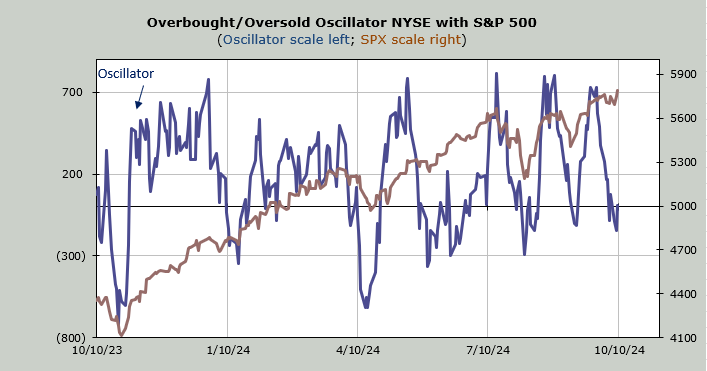
And now for sentiment. There was no change in the CNN Fear and Greed Index as it remains just ‘this’ side of Extreme Greed. The Investors Intelligence bulls backed off a smidge, but they are still at 53.2%. The ten-day moving average of the put/call ratio is too low. The 21-day moving average of the ISE call/put ratio is too high. But the one to watch though is the DSI. The S&P is now at 81, while Nasdaq is 82. If we rally much more, these will go into the danger zone.
New Ideas
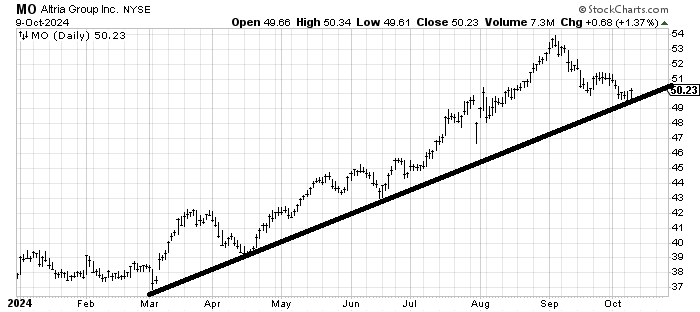
It’s time to take another look at the recession stocks. I know I call them the recession stocks when they are just mostly staples with high dividends. The stocks like Altria MO have corrected about ten percent and it has come down to tag the uptrend line. It is possible there is more work to do down here on this chart but the risk/reward is decent again with a stop under 49.
Today’s Indicator
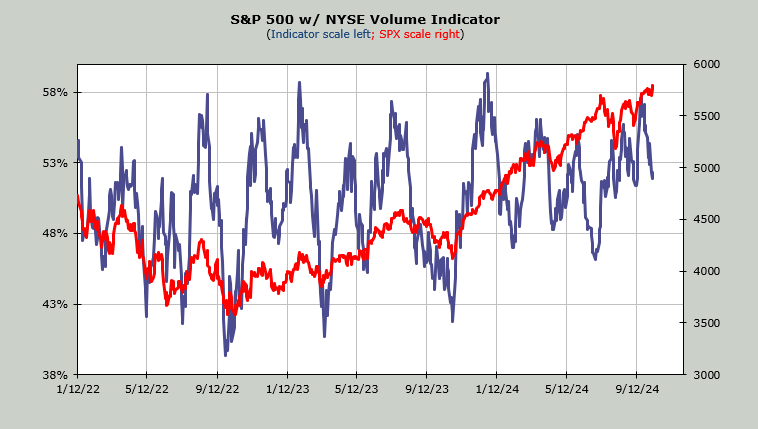
The Volume Indicator is still at 52% which is not oversold.
Q&A/Reader’s Feedback
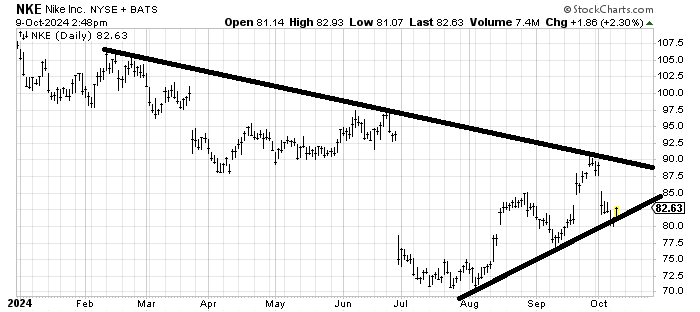
Nike NKE has been so bad for so long it’s hard to get excited over it but I like that it bounced off a higher low. I’d say the gap fill is what you’d look for. I’m still undecided if it can get up and over 90 though.
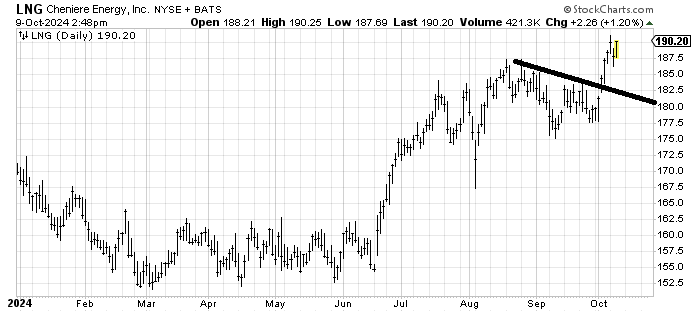
Cheniere Energy LNG has a measured target around192-195. It’s just not my style to chase a stock up so much already.
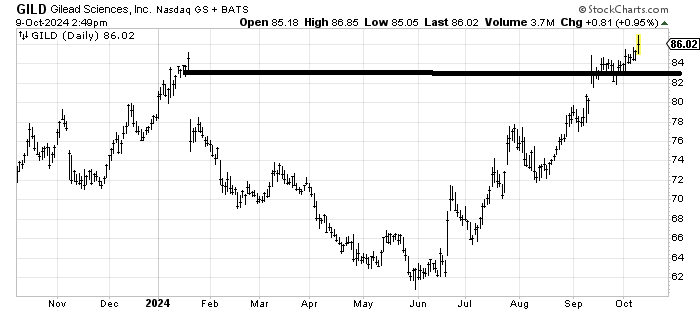
When we last looked at Gilead GILD I thought it would fill that gap around 82. It did. And then it kept on going. It’s possible it can get into the low 90s on this run, and if it does then the 90/100 rule would go into effect (90% of the stocks that get to 90 will get to 100) but I am not inclined to chase it. In the drug area I’d still rather go with BMY, PFE or JNJ.
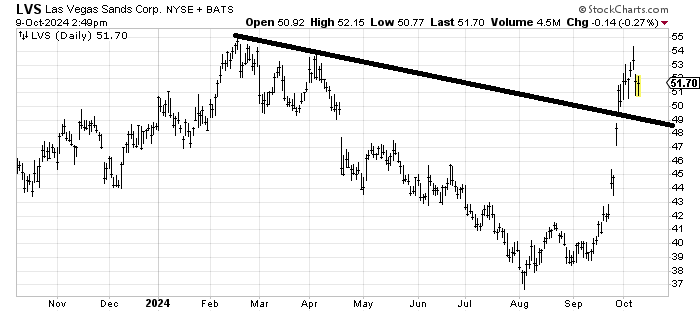
When I recommended Las Vegas Sands LVS in early September I did not expect this kind of move. It is up against resistance so I’m a fan of some profit taking up here. I might take a look at a trade on the long side on a pullback toward that line around 49-ish.
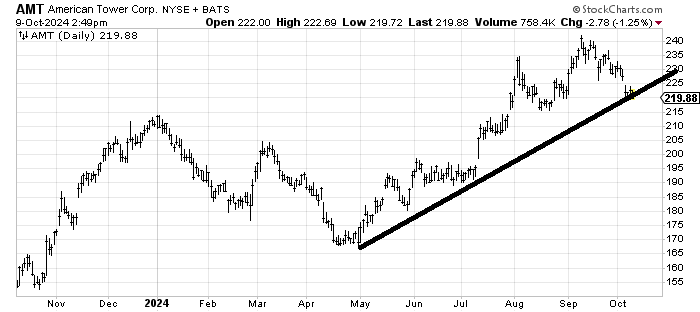
When we last looked at American Tower AMT a month ago, I had a higher upside target, but I was not a fan because the ‘income’ stocks felt overdone to me (like the Utes and recession stocks). AMT has now come down to support yet I am not ready to stick a toe back in yet. If it rallies from here to 225-230, it will look like a head and shoulders top. If you want to give it a try, I would say you want to use a close stop because the risk is to 190-ish.
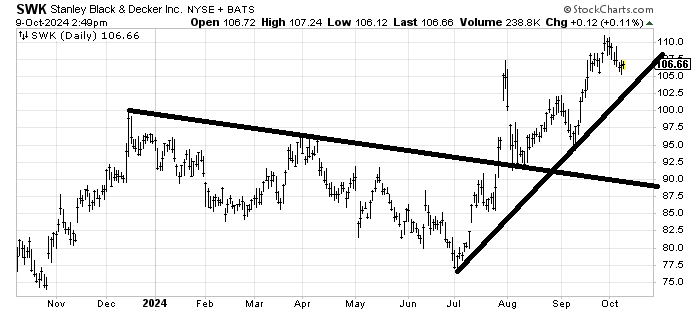
Stanley Black & Decker SWK has hit its measured target, so while the chart has done nothing wrong yet, it’s hard for me to like it up here. It’s got some support 102-103.