A Cautionary Tale of Breakouts Becoming Fakeouts
We got that rally last week, but under the surface, there are worrying trends.
You've reached your free article limit
You've read 0 of 1 free Pro articles.

The Market
In the end, we did get the rally that I had expected last week, but it arrived only after a much larger pullback than I expected as well.
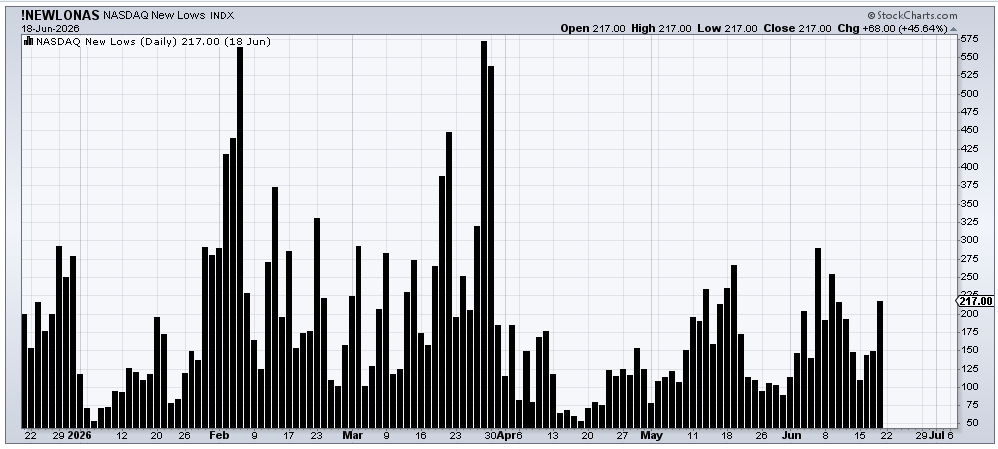
Here are a few of the statistics from Friday that were not great. The new lows expanded on Nasdaq to 217. By now, you should know my general rule that when new lows hover in the 100 area, I can live with it (although I don’t love it), but when they push to the 200 area, it’s time to fret. The chart is shown below.
The Bank Index, a group I have liked for a few weeks now, was finally discovered by the TV folks, and so naturally, they reversed and closed red. They needed a rest anyway, but that is terrible action on a day the S&P was up 80. I’m in favor of taking some profits.
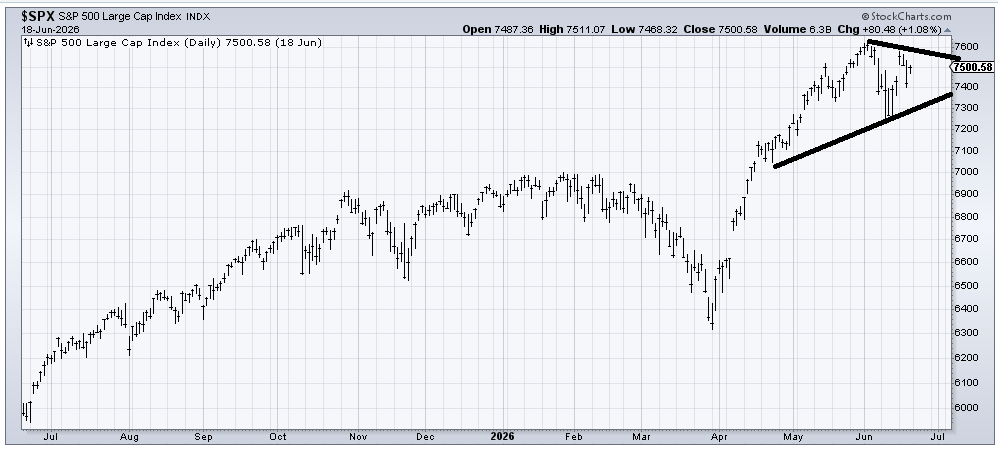
Sentiment-wise, the DSI for the indexes is in the mid 70s (neutral), but the VIX is back to 19, so that’s on the radar for the week. Again. I realize you might be thinking, come on, it’s been back and forth in the teens for a month. It has. And you know what? The S&P is exactly where it was a month ago, and if you look at the chart, the last month has been the first bout of volatility we’ve seen since that late March low. Heck, even the SOX has had some volatility.
But today I want to address a pattern I have seen in this market that I’m not certain I have seen before. Naturally, there is no way to quantify it. There are an awful lot of stocks that soared, broken out of bases, or at least consolidations, and then given it right back up, and more. And it’s not just one group.
My first thought is that we’ve gotten the shorts to cover because that is exactly what the charts would look like if that were the case. But the stocks are so random for the most part, and the short interest in some of them was never that high. Be that as it may, when breakouts become fake-outs, we should be aware.
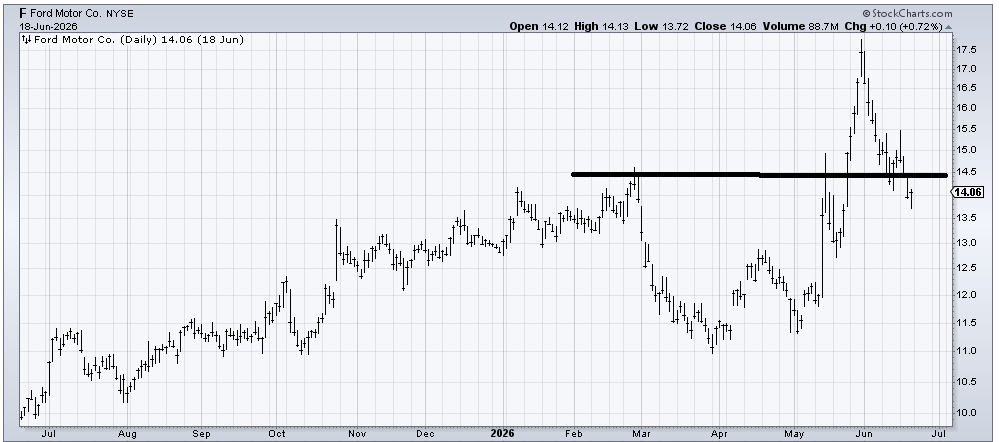
Look at Ford (F). That move over 14.50 was terrific. But it not only gave it up in a hurry, it barely took a breather at 14.50 on the way back down.
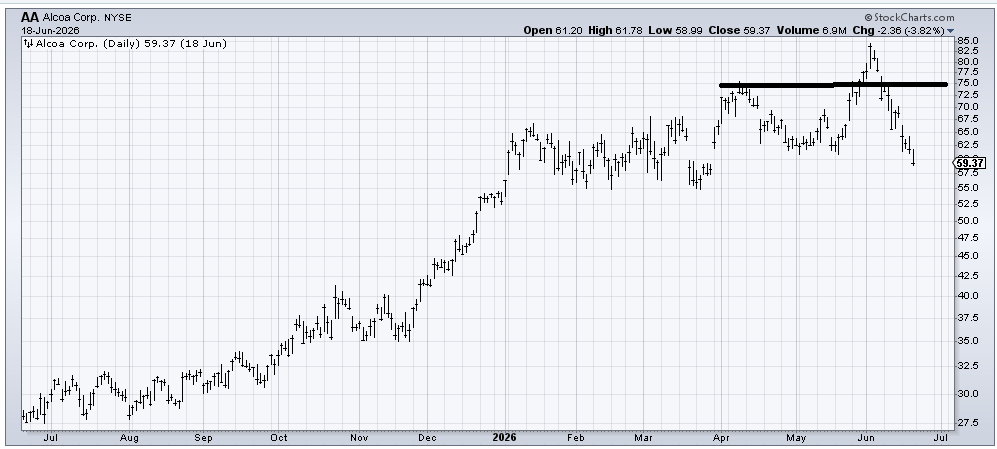
How about Alcoa (AA), where I thought that move up and out of the range was terrific. I thought a pullback to the 75 area would be buyable. Now it is even lower than it was in mid-May.
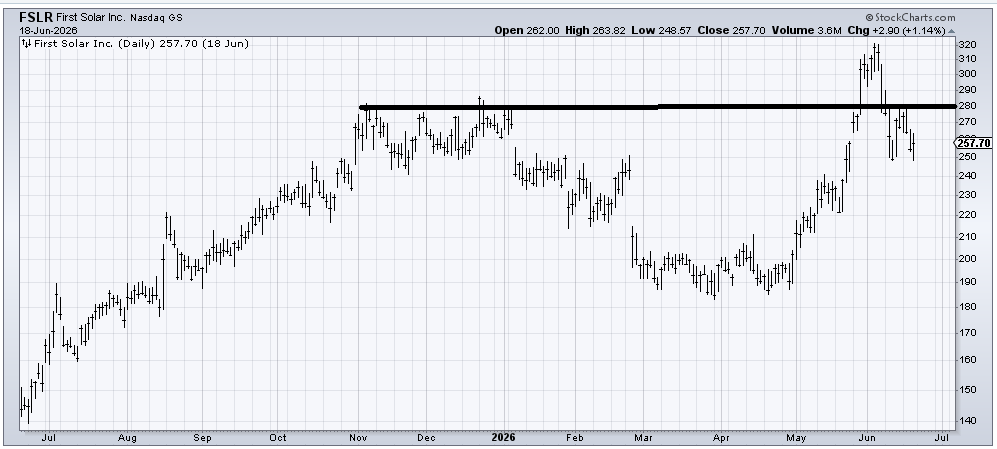
Look at the breakout in First Solar (FSLR). It did not even pause on the retreat back to the breakout level, or when it filled that gap at 258.
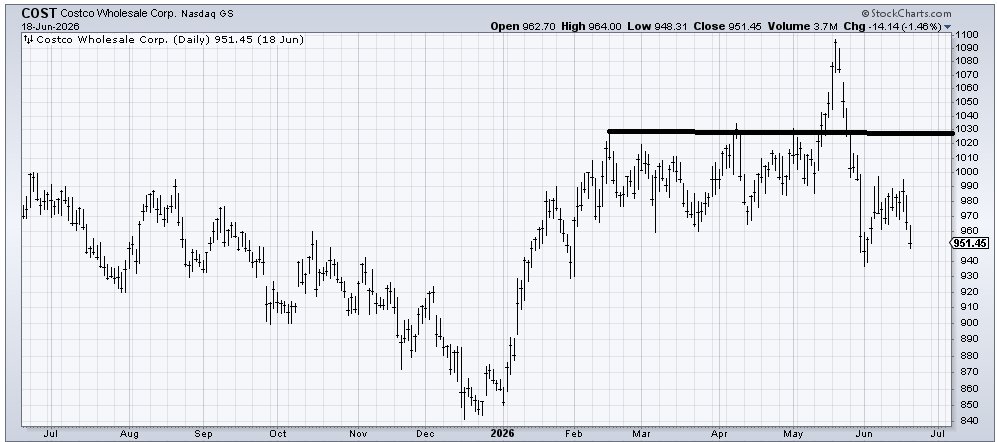
Costco (COST) is another chart that did the same thing. A terrific breakout at 1030, ran up seven percent, and not only didn’t stop at 1030, it plunged right through what should have been support in the upper 900s.
So many of the software stocks have done something similar. At least there you can understand, they are in the same group. But what do Costco, First Solar, Ford, and Alcoa have in common? I’m sure someone can come up with something, but from my perspective, that is not healthy action because it means the only group with any staying power has been the semis. Everything else gets its day or a few in the sun, but then it proves to be ephemeral.
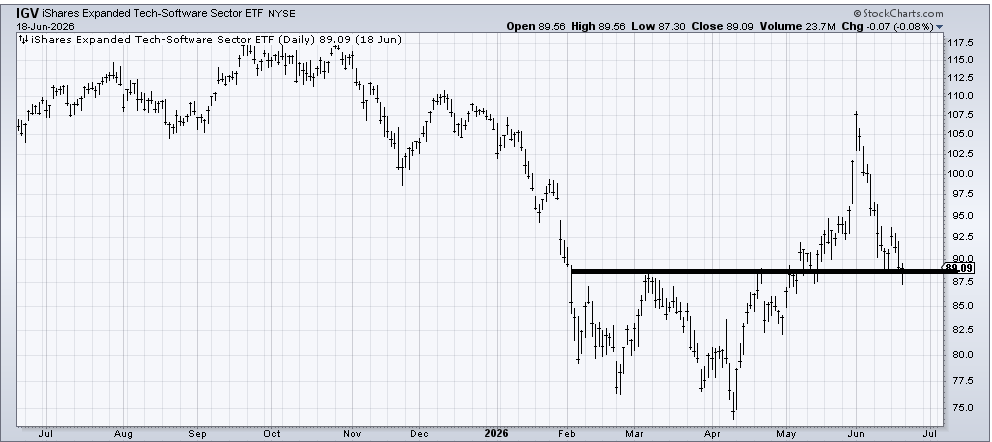
This is the spot IGV should hold and rally from.
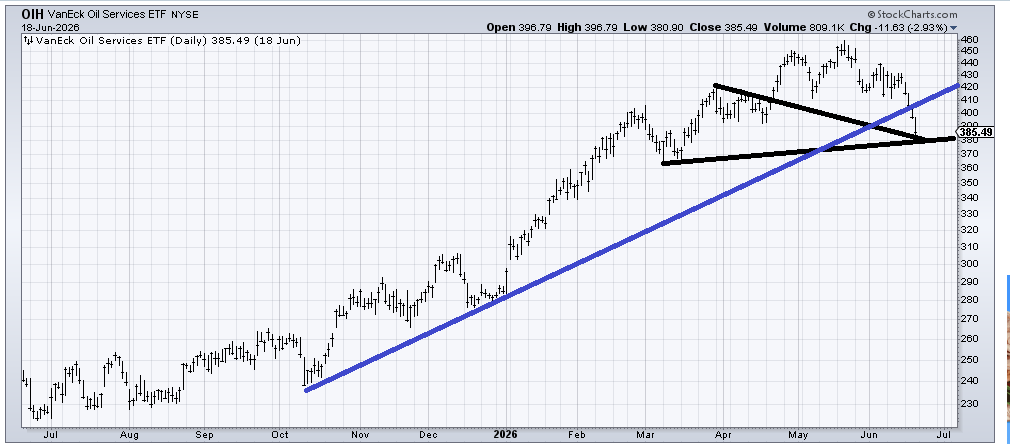
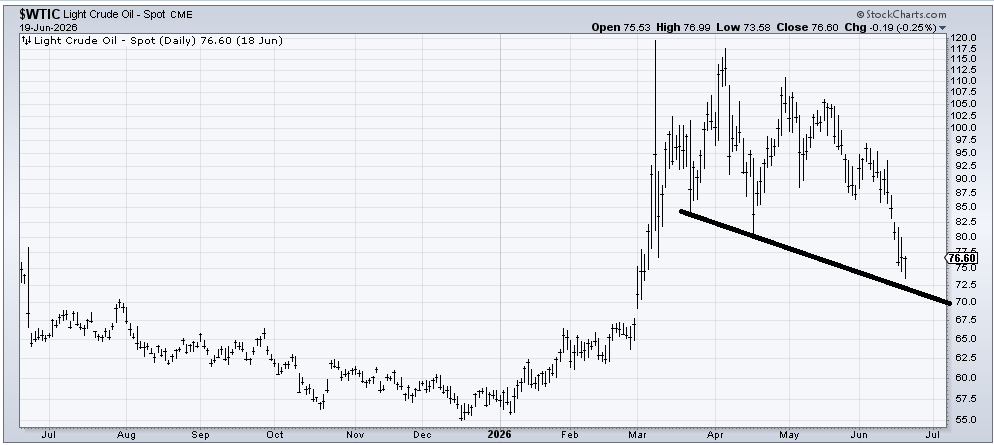
One final note is on oil, WTI. That low 70s area held, and the DSI is 14. As I noted last week, I think that low 70s area is playable for a bounce if the DSI slips under 15. I would not overstay my welcome, though.
New Ideas
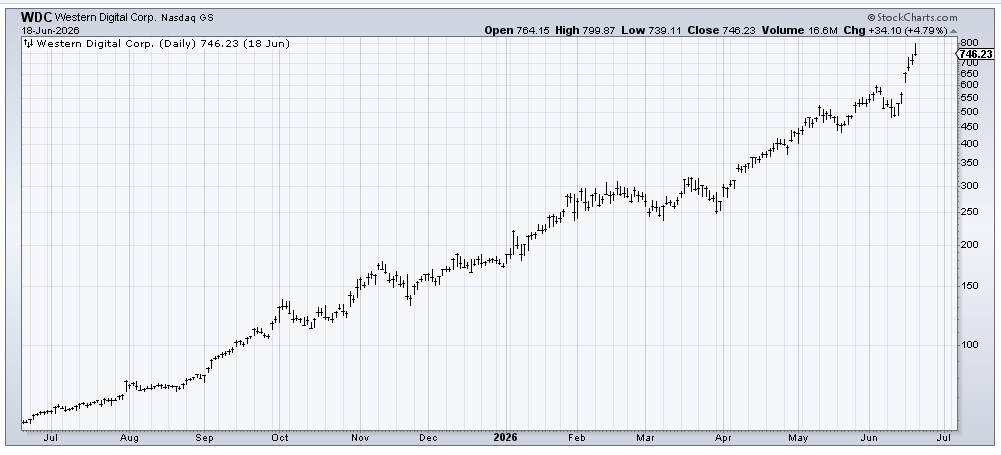
I would never advocate shorting a strong stock, but I did promise to point out when I saw a semiconductor stock that looked parabolic. Western Digital (WDC) has rallied 50% in a week and done so on multiple gaps. Then Friday, it closed at the low of the day. At the very least, it needs a pullback.
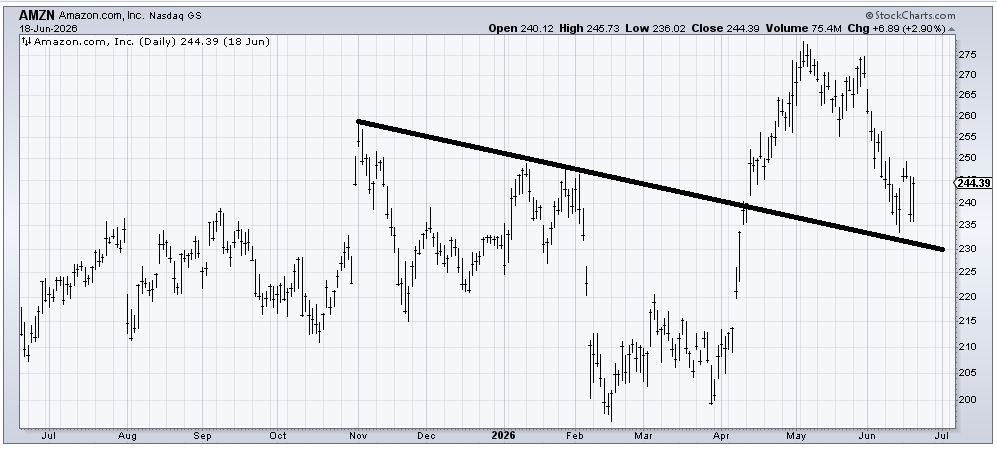
We might even put Amazon (AMZN) in the same pile as the stocks mentioned above because it had that breakout over the November high and gave it up. So why is the chart different than those above? You see how it had that failing rally in late May? That is the way charts should act, by giving us a warning.
In any event, the sort of double top it formed measured to 235, where it got last week, so this area ought to be a place to buy some. Under 230 and I am wrong.
Today’s Indicator
The new lows are discussed above.
Q&A/Reader’s Feedback
Helene welcomes your questions about Top Stocks and her charting strategy and techniques. Please send an email directly to Helene with your questions. However, please remember that TheStreet.com Top Stocks is not intended to provide personalized investment advice. Email Helene here.
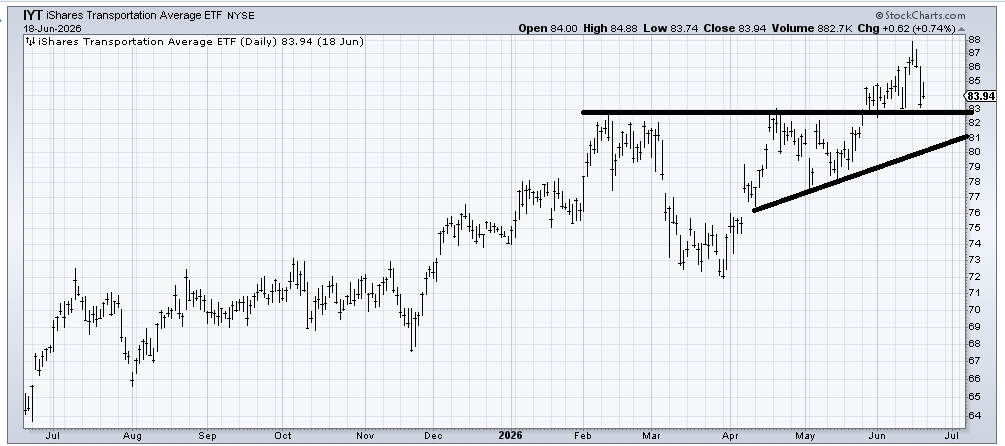
I have been cautious on the Transports for about a week now, and while IYT looks vastly different than the actual Transportation Average, I would put it on a list to be watched closely. That breakout three weeks ago should have gone further (see the discussion above), so if IYT can hold 83 and rally, then that’s good. If it makes its way back to that lower line in the 80-81 area, I’d say it should bounce, but that is not as good. The sooner buyers step up, the better; the more they wait, the weaker it is.
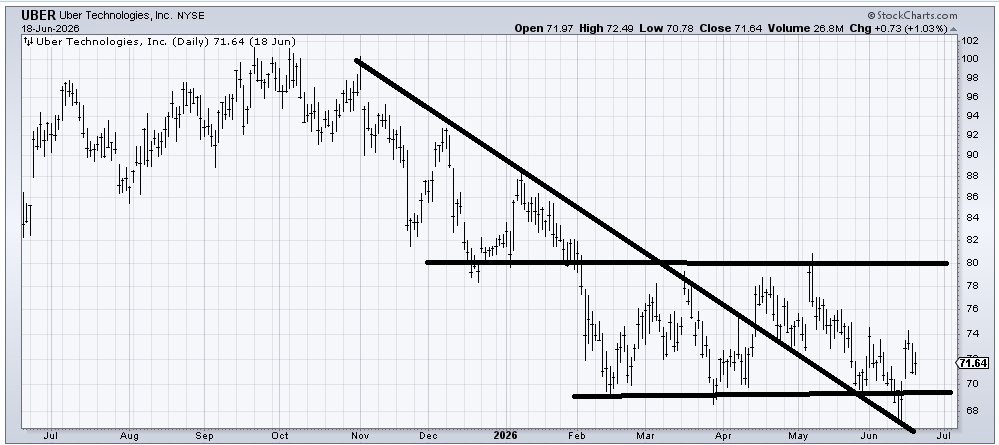
We’ve had some decent trades in Uber (UBER) since it has been in this trading range, so since we are close to the bottom of the range, my sense is the risk/reward is decent. Back under last week’s low would be bearish.
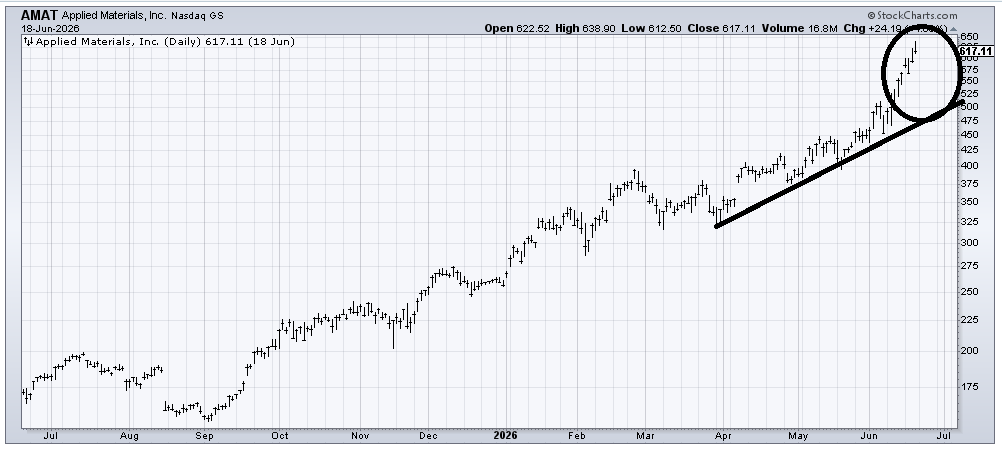
Applied Materials (AMAT) has gone a little parabolic, but I do want to point something out—you may need to squint to see this—every day last week it closed at the low of the day. I’ll call it vulnerable to a correction, but unless/until there is a sign of a failing rally, that’s all I see for now.
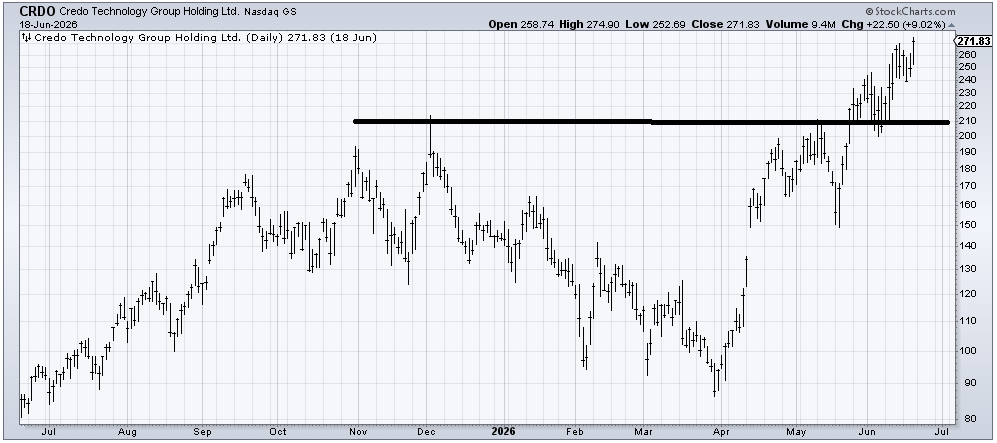
Credo Technology (CRDO) did exactly what a chart should do. It broke out of a range at 210, came back to test it, and then rallied again. It’s a bit overbought/overextended here, but otherwise has done nothing wrong. It has a measured target in the 300-320 area. Unfortunately, a stop is really far away, but back under 240, and I’d begin to fret.
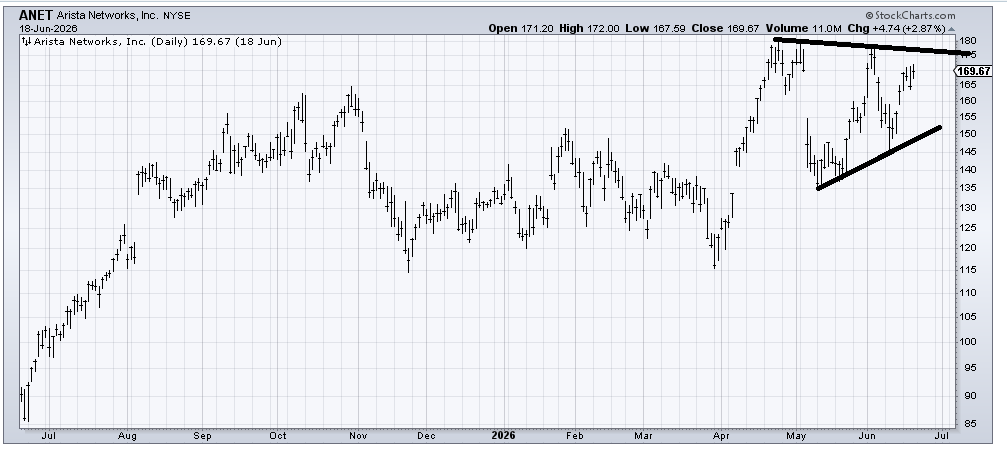
Arista Networks (ANET) has now made a third lower high. But if it stays over 165, I’d give it the benefit of the doubt to get over that 175 (upper line) area.
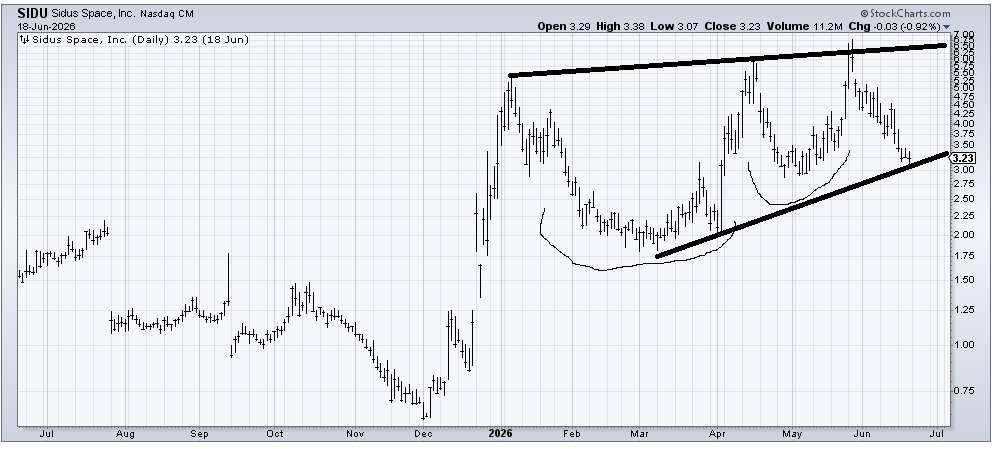
Sidus Space (SIDU) is the sort of chart that, at least in 2026, has spent a bit of time rounding under before it makes a move, so while this is a support area (but again, see how it rallied and then gave it all back?) I might let it be for a few days to see if it can hold this 3 area. Or you could nibble with a stop under 3, because if it breaks 3, it won’t be good.
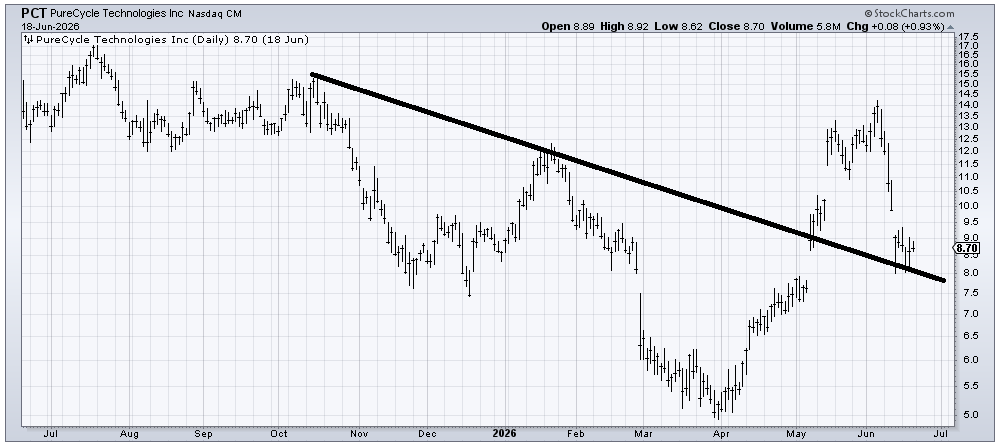
Pure Cycle (PCT) is oversold, and maybe on a longer-term basis, it is forming the right shoulder of a head and shoulders bottom, but it’s going to take weeks/months before I am convinced this stock can do much more than an oversold bounce. Unless it can gap up over 10, leaving the last week as an island, otherwise it seems like a poor risk/reward here.
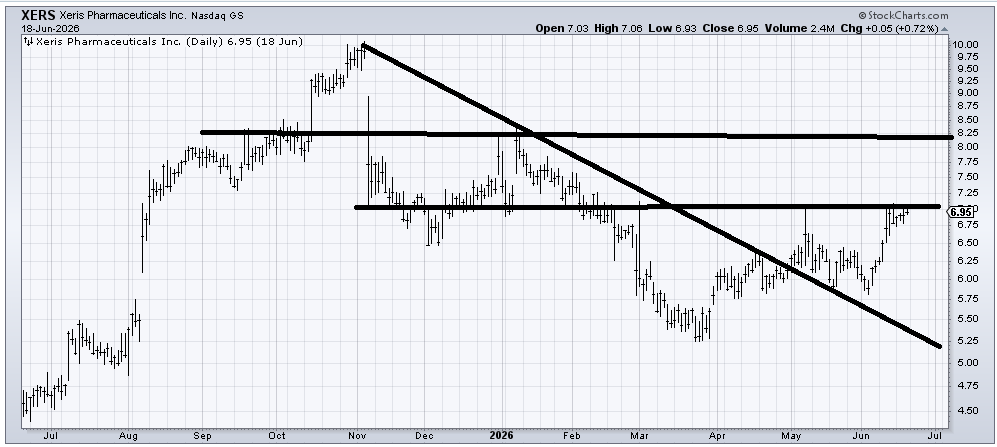
Xeris Pharma (XERS) might be trying to form a base, but look at all that resistance it has to eat through between 7 and 8.25. If it can get over 7 and hold it, the chances improve, but I’d opt for a wait-and-see right now.
While I think WTI bounces from this general area and OIH probably does as well, breaking that blue uptrend line is bearish, and so a bounce off 375-380 into that 400-415 area should probably be sold.