What's Next for Johnson & Johnson Stock Amid Shockwave Medical Deal?
Let's examine the charts of the healthcare giant.
You've reached your free article limit
You've read 0 of 1 free Pro articles.
Johnson & Johnson JNJ has agreed to buy Shockwave Medical SWAV for $335 per share in cash. Shockwave makes cardiovascular intervention devices. Is this enough to get JNJ's stock price to beat faster?
Let's check out the charts and indicators.
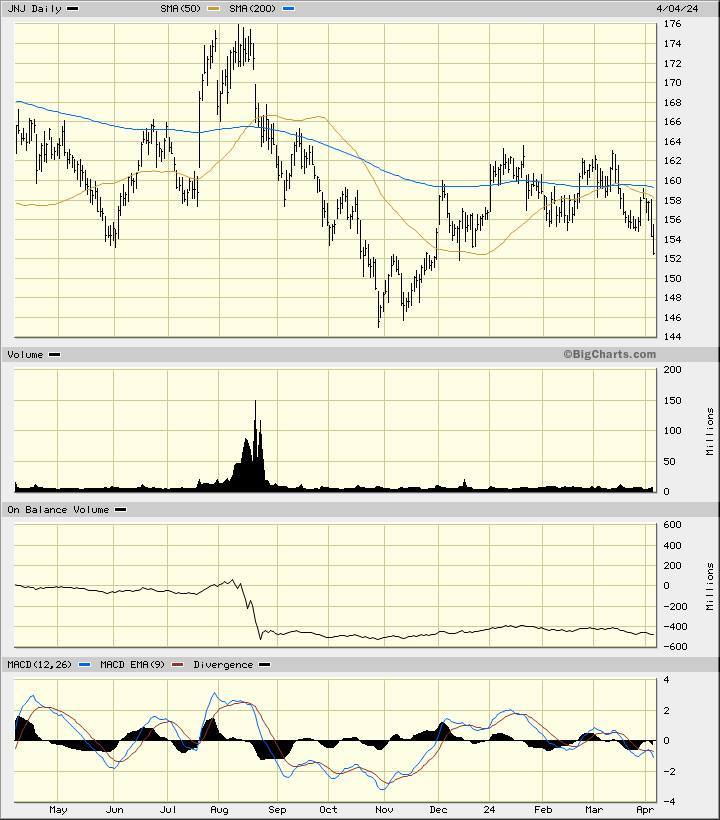
In the daily bar chart of JNJ, below, I can see that share prices made a high back in July/August. The shares declined to a low in late October followed by a rebound into January. The January high fell way short of the August high and prices have rolled over to the downside. JNJ trades below the declining 50-day moving average line and below the weak 200-day moving average line.
The On-Balance-Volume (OBV) line has been disappointing and weak. Meanwhile the trend strength is weak and the Moving Average Convergence Divergence (MACD) oscillator is below the zero line.
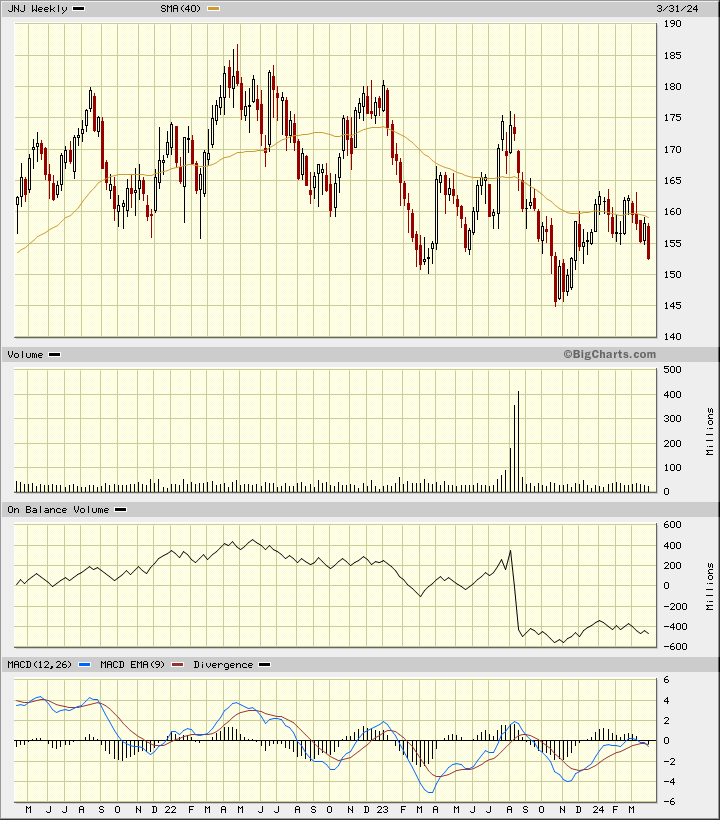
In the weekly Japanese candlestick chart of JNJ, below, I can see that share prices have moved lower in a downward sloping channel for the past two years.
The weekly OBV line is bearish and the MACD oscillator is below the zero line. I see no lower shadows on the recent candles so traders have not begun to reject the lows yet.
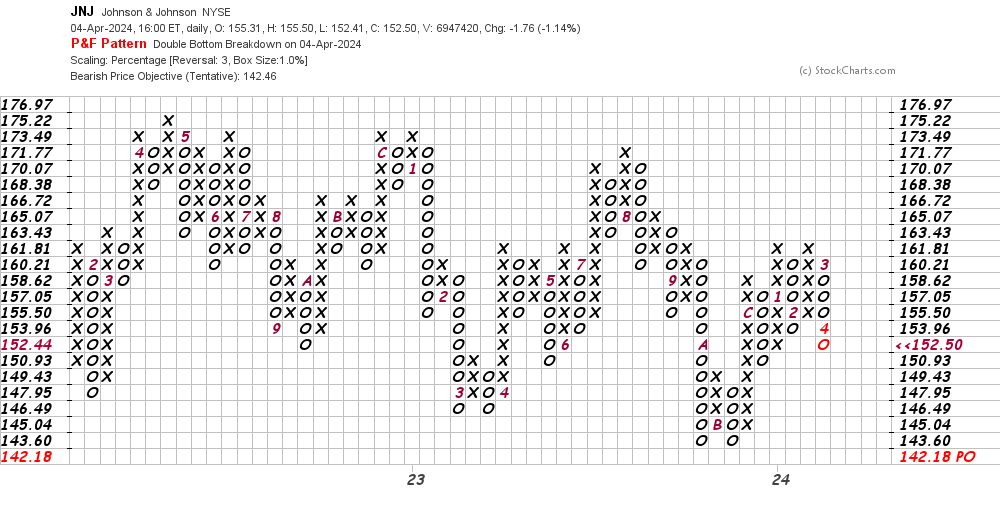
In this daily Point and Figure chart of JNJ, below, I can see a downside price target in the $142 area.
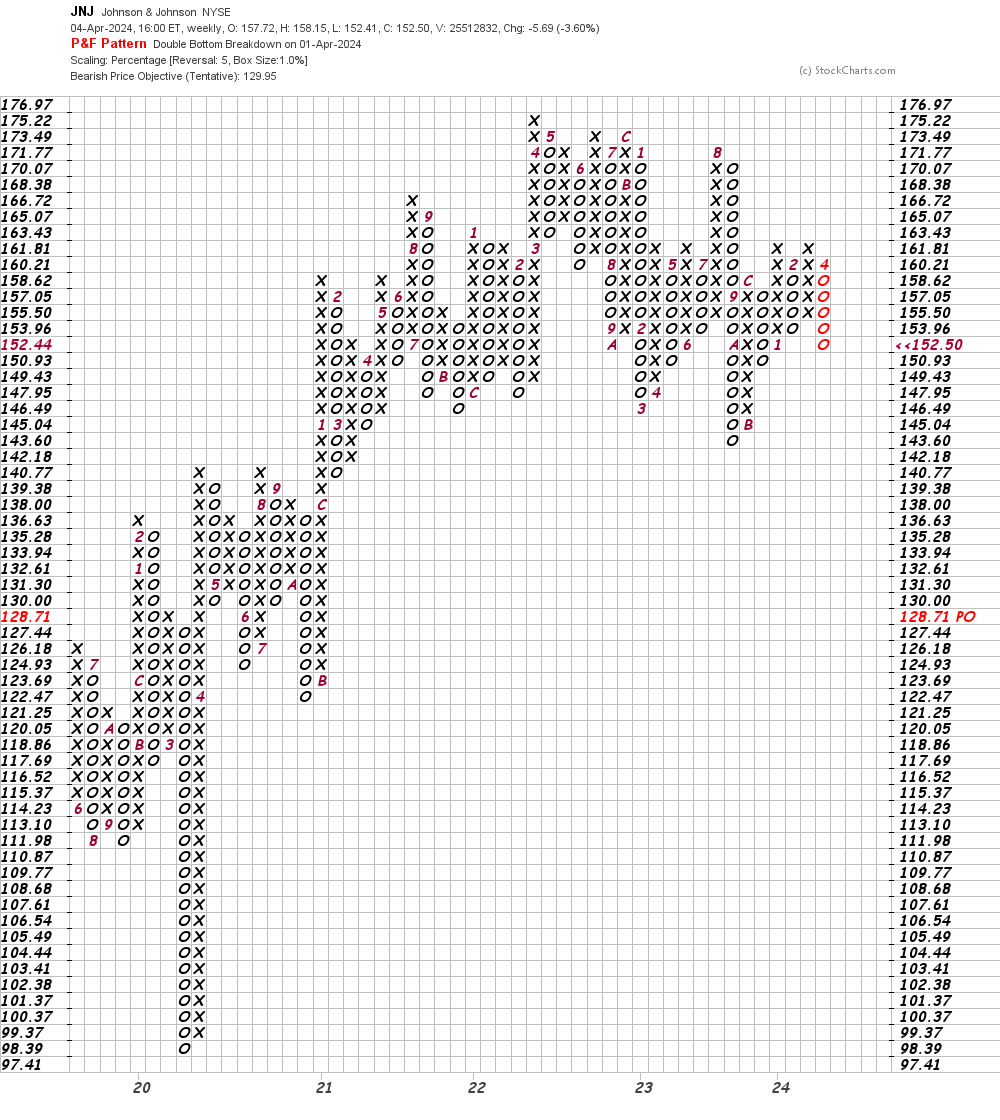
In this weekly Point and Figure chart of JNJ, below, I can see a price target in the $130 area.
Bottom-line strategy: Leadership at JNJ is very good at handling lawsuits and acquiring new companies but maybe this time they have met their match in the charts.
Employees of TheStreet are prohibited from trading individual securities.