Are the Bank and Industrial Sectors the Key to What's Next?
How might they impact the new highs list?
You've reached your free article limit
You've read 0 of 1 free Pro articles.

We finally got a down day, and it really was mostly a chop-fest all day. A few more days like that, or even a few percentage pullback would be helpful too, just to get the charts to set up rather than keep ratcheting higher.
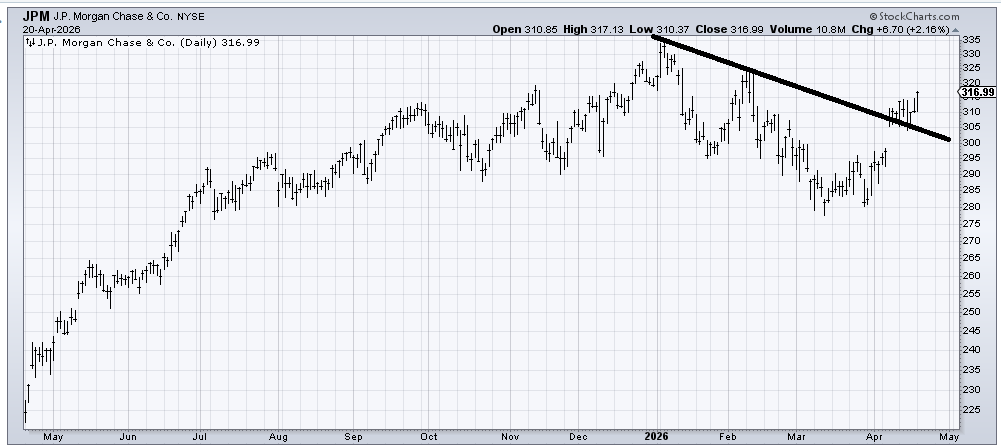
I don’t love the chart of JP Morgan (JPM) just because it’s at the top of the range (I prefer the down and outers), but let’s use this chart as an example. That gap up in early April was followed by nearly two weeks of chopping, enough to then get some more momentum to push on ahead.
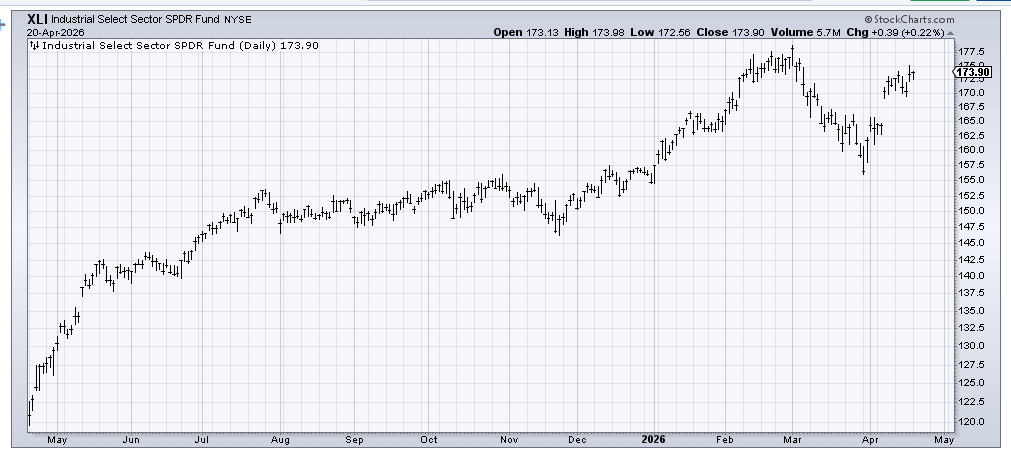
I have been going on about the Banks and Industrials and how I think they should be given another chance to rally after resting. XLI, an ETF to be long the industrials, has also been milling about for nearly two weeks. So let’s see if it can push further upward after this rest. If it can’t, then we should start to fret.
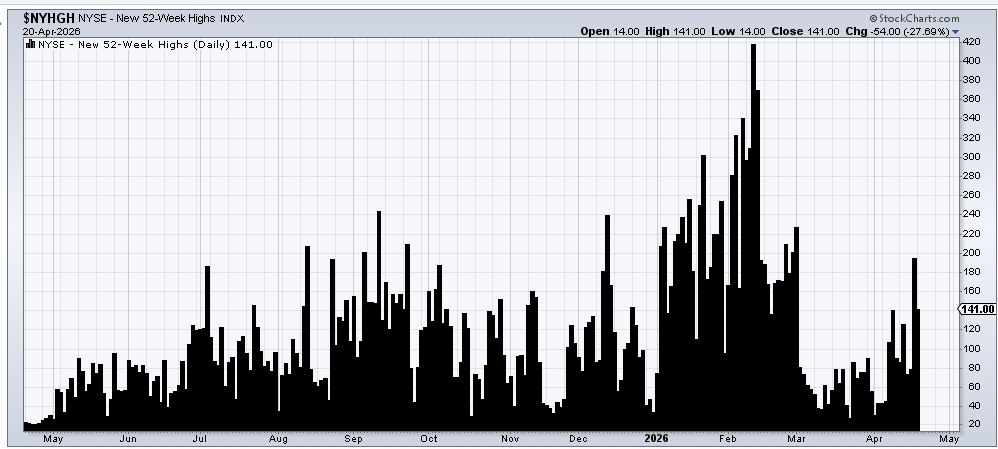
We would start to fret not because it is one group that can’t keep up, but because failures would then make their way into the indicators. For example, the number of stocks making new highs has lagged. I have said that is to be expected because we were coming off a low. But now we have to watch new highs because Friday they did not exceed the prior reading, and on Monday the NYSE saw a mere 140 new highs, which is rather pathetic for a market at new highs.
These sorts of statistics become a problem when the market gets back to an intermediate-term overbought and some of the momentum or breadth indicators roll over.
For example, if the number of stocks making new highs is still running light when we get intermediate term overbought (my expectation for that is around mid-May), then I would put this on the negative side of the ledger.
If, when we get back to intermediate term overbought, the McClellan Summation Index is rolling over, I would consider that a problem. For now, it continues heading upward.
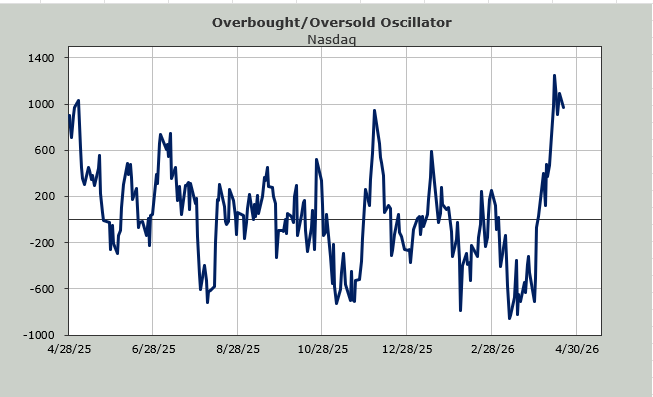
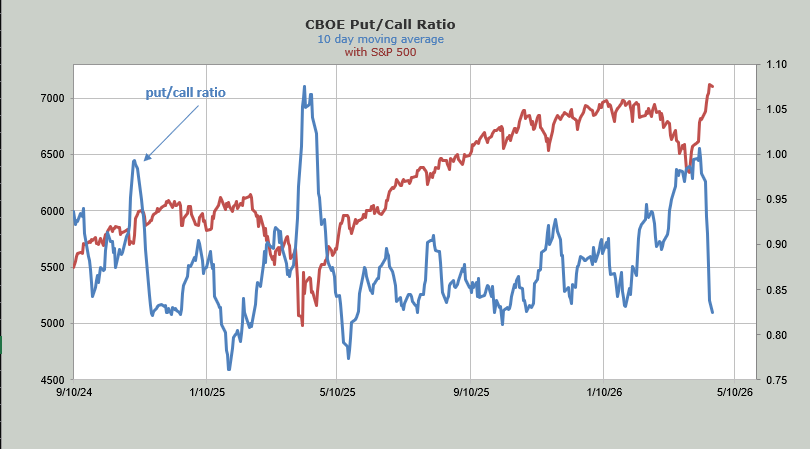
The ‘getting exuberant’ sentiment is bothersome, but at least the Daily Sentiment Indicator (DSI) backed off to 75 for Nasdaq with the choppy day on Monday. The put/call ratio even rose to .89 but the ten-day moving average of the put/call ratio is now down to .83.
So once again, should we get intermediate term overbought, and this indicator is in the low 80s, or lower, I would get concerned. One indicator doesn’t change my view. I like to see a confluence of indicators lining up. For now, the bulls get the benefit of the doubt until the indicators roll over.
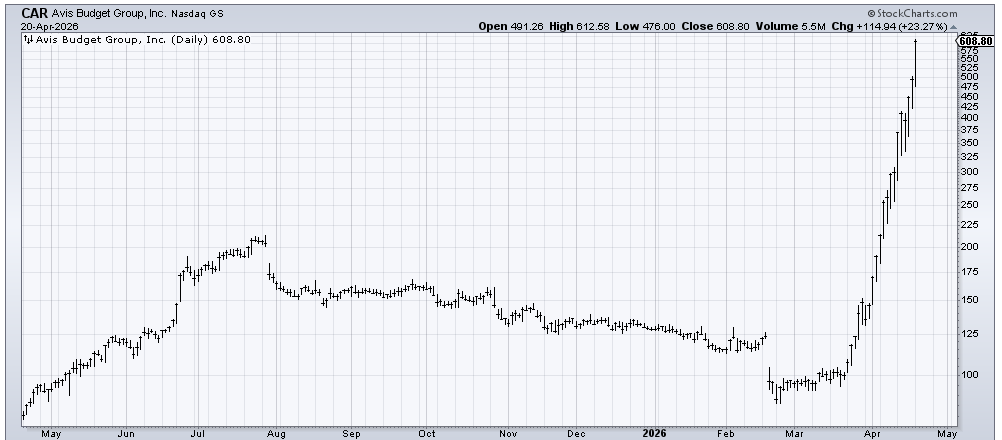
And just so we’re clear, while I like that the Transports have made new highs, I don’t love that they are being led by Avis (CAR) , which is up sixfold in three weeks and was up over 20% on Monday. That type of action doesn’t feel healthy.