What's the CESI and Why Do We Follow It?
Let's talk about the Citibank Economic Surprise Index.
You've reached your free article limit
You've read 0 of 1 free Pro articles.
* What’s the Citibank Economic Surprise Index and why do we follow it?
Over the last few weeks, the market narrative has shifted from being predominantly focused on the timing of potential Fed rate cuts toward the continued strength of the economy and earnings prospects. The driving forces behind this shift has been the bulk of economic data supporting a soft landing for the U.S. economy as well as quarterly earnings that, in the aggregate, surprised to the upside with more growth slated for the coming quarters.
We use a variety of tables and charts to track the economy, and one helpful snapshot is found in the Citibank Economic Surprise Index, better known as the “CESI.”
The index represents the sum of the difference between official economic results and forecasts. A sum over 0 means economic performance is generally beating market expectations, while a total below 0, means economic conditions are generally worse than expected. Said another way, the CESI tells us if the economy is performing better than or worse than expected.
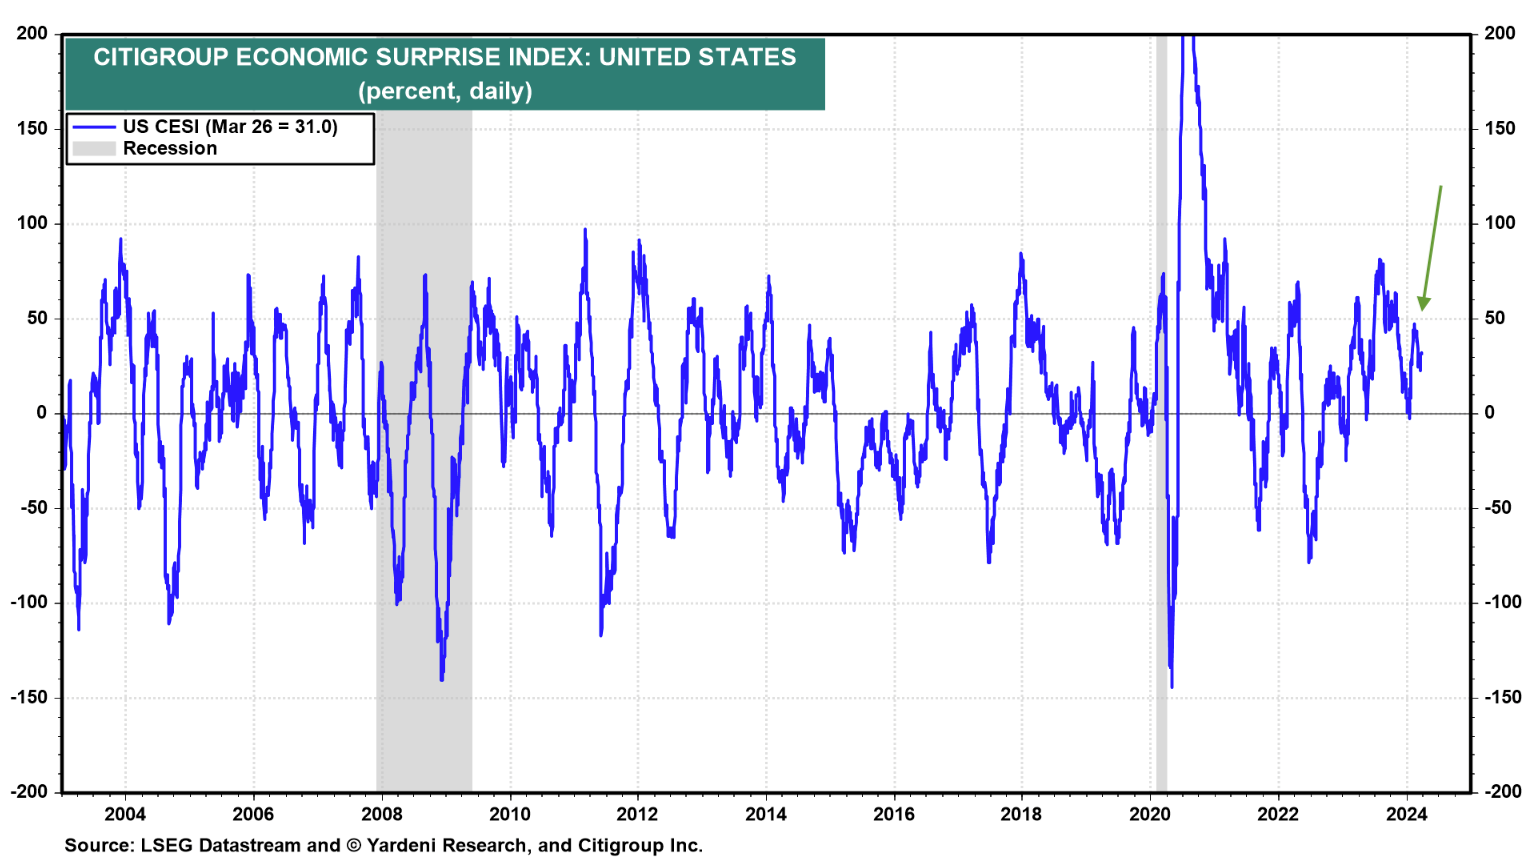
As you can see in the chart above, the CESI’s readings so far in 2024 have been above market expectations, which has also helped support the favorable outlook for corporate earnings. Examining figures published by FactSet, the last few weeks we’ve seen upward revisions to consensus S&P 500 EPS expectations for Q2 2024 and H2 2024. They are not substantial, but directionally they are favorable.
To support the current market narrative and drive the market higher on a sustained basis, we will want to see the CESI index remain above 0 as we move through Q2 2024. And the greater the positive distance from 0, the better.
Next week, we will be revisiting the CESI several times because we have the usual start-of-the-month barrage of economic numbers. These include the dual final March Manufacturing and Services PMIs from ISM and S&P Global, ADP’s March Employment Change Report, and the March Employment Report. We will also be checking the rolling GDP forecast captured by the Atlanta Fed’s GDPNow model, which as of March 26 put Q1 2024 GDP at 2.1%, roughly on par with last year.
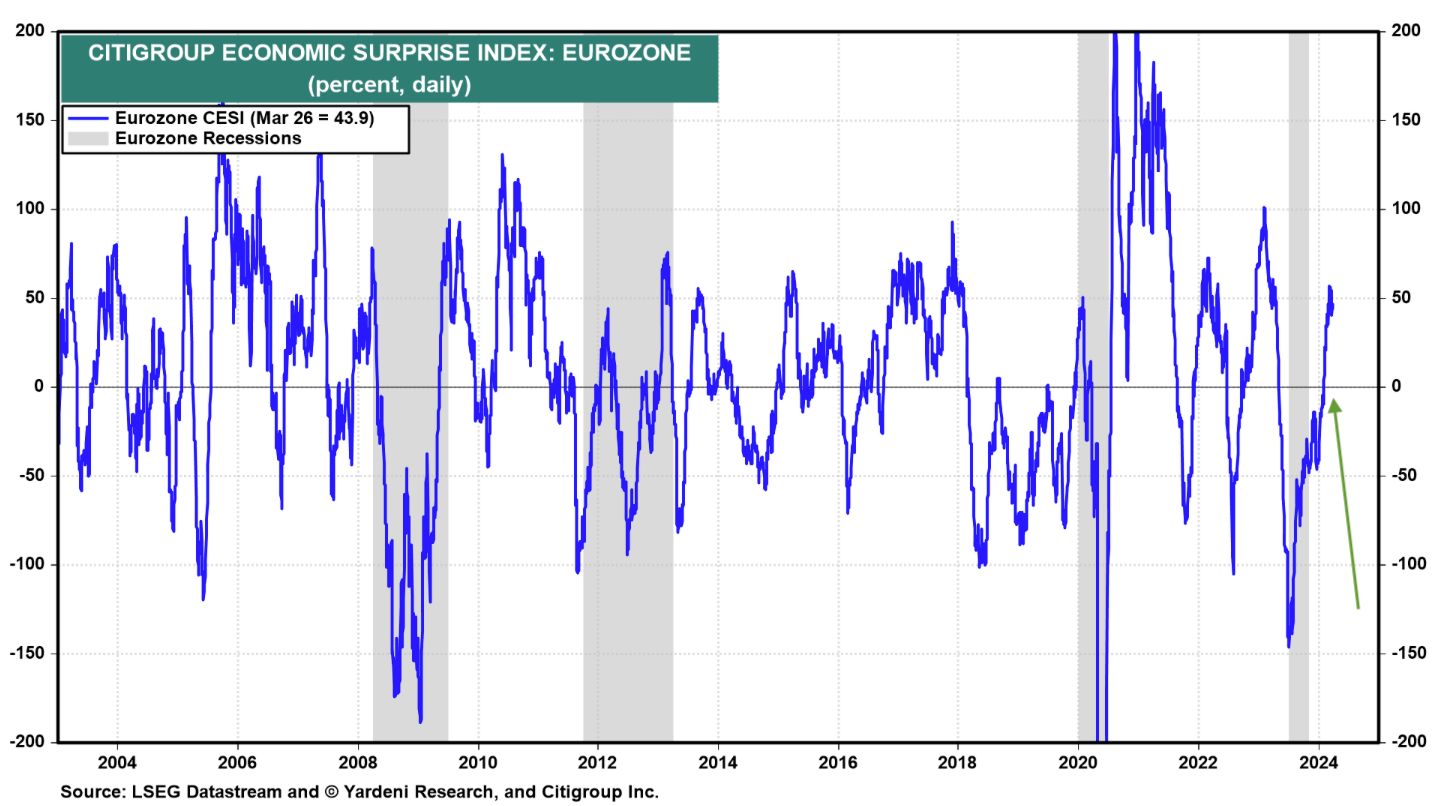
Looking at the CESI for the eurozone, while it continued to languish early this year, it has recently turned up into positive territory, signaling that economy is doing maybe not great, but better than the market expected. That’s another contributor to those upward EPS revisions for the S&P 500 basket of companies. Considering the March PMI reports for the eurozone out next week, we’ll be checking on the below chart as well.