Weekly Roundup: Keeping Our Eyes Open for a Santa Claus Rally
We made multiple moves during the holiday week, adding a new holding along the way.
You've reached your free article limit
You've read 0 of 1 free Pro articles.
We had a more subdued than usual stock market over the last few days due to the early close on Tuesday and its closure on Wednesday for the Christmas holiday. That mid-week lull led to many taking time off as we approach the end of 2024, which has been a strong year for the market and the Pro Portfolio. Even though trading staffs and trading volumes were thin, opportunities presented themselves and we leaned into them this week, bringing the Portfolio’s position count back to 27 holdings.
Tuesday marked the first day of a potential Santa Claus rally and the S&P 500 as well as the Portfolio ended nicely higher, but the market’s move lower on Thursday and Friday dialed back some of those gains. While the S&P 500 and Nasdaq Composite closed the holiday week modestly higher, since Tuesday, the S&P 500 was down slightly and the Nasdaq Composite off close to 0.5%.
As we discussed on Tuesday, even though we follow the data, we have to be cognizant of investor sentiment as well as market mindset and superstition when it comes to seasonal patterns in the market. The "why" behind that is that these patterns persist. So, while a Santa Claus rally has yet to show itself after the first three days, we still have the final two days of 2025 and the first two days of 2025 for it to emerge. Keep in mind, historical data shows positive returns four-fifths of the time, with the S&P 500 averaging a 1.3% gain across the seven-day period.
While the market is not quite oversold now, its action on Thursday and Friday has us moving back to that condition. Should the market become oversold early next week, a snapback could lead to the Santa Claus rally emerging. Lending a potential helping hand, data from LSEG shows that investors pumped a hefty $34.38 billion into global equity funds in the week through December 25, the largest amount in six weeks. As we think about that data and game out potential Santa Claus rally timing, next Thursday and Friday bring several pieces of key December economic data, which means we are likely to see more investors back in the saddle.
We’ll be watching the market setup over the next few days as we close out 2024 and start 2025. As we keep an eye on the potential seasonal pattern, we’ll be reviewing what went right for the Portfolio this year, but we’ll also be shining a light on what we could have done better. And, as Warren Buffett famously said, “It’s good to learn from your mistakes. It’s better to learn from other people’s mistakes.” With that in mind, we’ll also be reviewing where the market got it wrong and where it could get it wrong in 2025.
Catching Up on the Portfolio This Week
As we expected, trading volumes for the market were seasonally thin, but we used that to the Portfolio’s advantage this week by picking up shares of companies that were oversold, had an improving technical setup, or both. And it should go without saying that the fundamental outlook was favorable as well. That combination led us to start a new position in American Express AXP shares on Monday as well as pick up more shares of Lockheed Martin LMT and Qualcomm QCOM. On Thursday morning, we added more shares to our Labcorp LH holdings and later that day we did the same with Waste Management WM shares.
The combination of that activity puts our cash position at just over 8% of the Portfolio’s assets, which means we will continue to keep close tabs on some of our larger position sizes as the Santa Claus rally period continues. It also means we will need to be far more selective with next moves for the Portfolio. You’ve seen us favor oversold stocks of late, and near term that is likely to remain a factor in our decision-making process, provided our underlying thesis remains intact. We will also endeavor to further position the Portfolio for the coming year.
Key Global Economic Readings
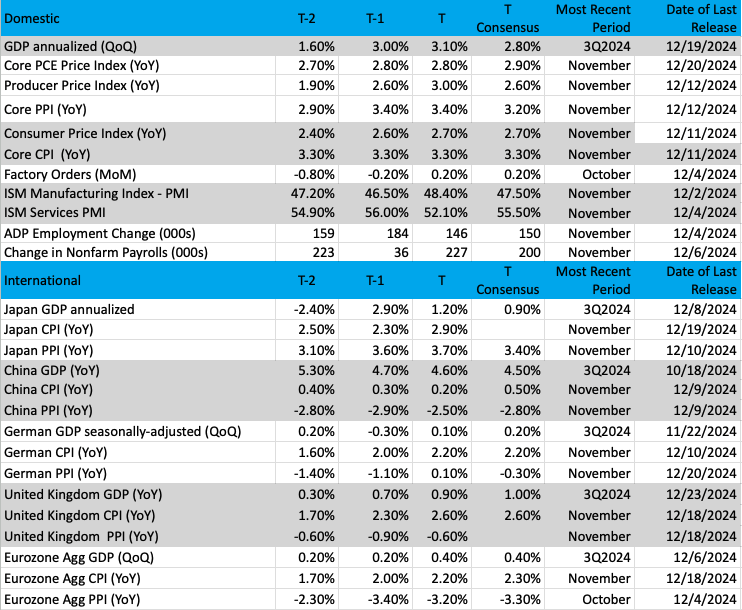
(Note: T is the most recent period, T-1 is the prior period's reading and T-2 is two periods back, the intent being to illustrate any trends)
Chart of the Week: Two-Year Treasury Yield
We hear a lot of chatter in the market media about the two-year yield and why it is important to monitor. Now, this yield is considered a nice proxy for estimating the fed funds rate, the one lever the Federal Reserve can use to control liquidity in markets and thus the economy. As you may know, the Fed has a dual mandate — to maintain price stability and foster full employment. This fed fund lever is used to stimulate or slow down the economy if it is running hot.
So where does this two-year yield come in? Bond investors use this intermediate-term rate to estimate where the funds rate will be in two years. Anything shorter than that (six months, one year) is much "noisier," and may give off some false signals as prices are much more sensitive in the short term.
The two-year yield is flexible but also a sign of where money is flowing. Remember, when yields are rising, bond prices are falling, and hence money is flowing out of bonds. That seems to be the case now, certainly since the Fed started cutting rates in September of this year.
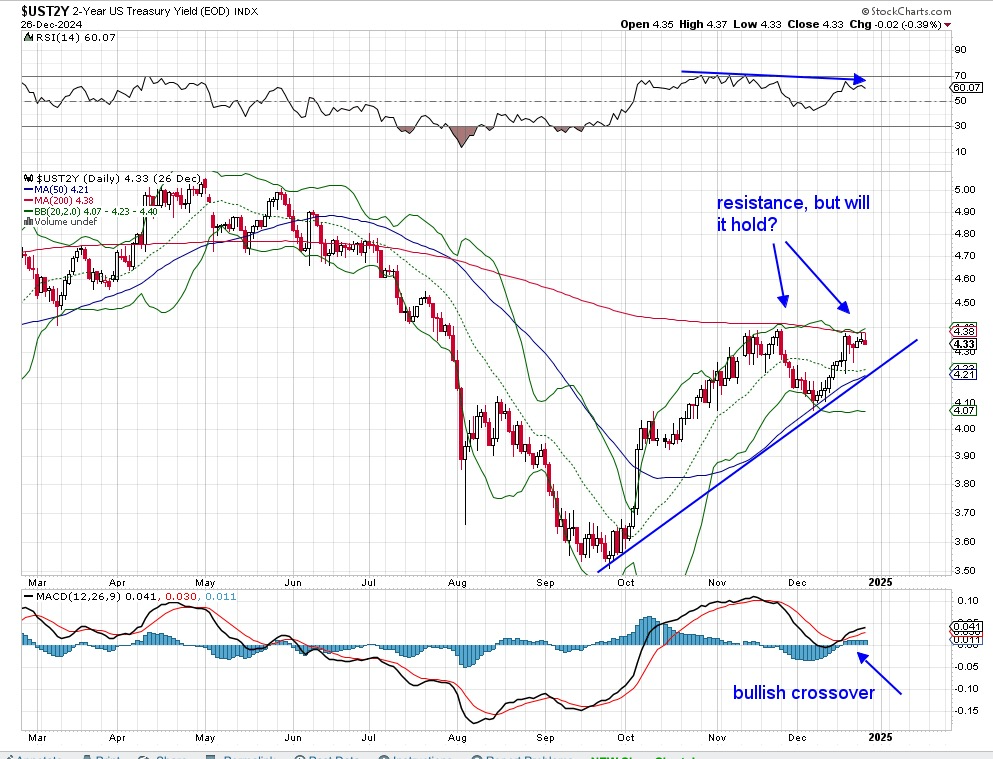
Notice the huge rise in yield, those levels are on the right side of the chart, from 3.5% to the current reading of 4.4%. Over three months, that is an enormous increase and sends a message to the markets and the Fed: Inflation is sticky and is likely to remain so for the foreseeable future. Conversely, if yields were lower, the bond market would not be as concerned about inflation.
Back to the chart. The current yield is banging its head against the 200-day moving average again, the third time in six weeks. If that breaks to the upside, there is plenty of room for this yield to rise, which is currently above the Fed’s targeted fed funds (4.25%). What does that mean exactly if the two-year is above the fed funds? Basically, the market (bond) is saying the committee should consider slowing down rate cuts even more than they mentioned in their meeting last week.
Does that mean the Fed is losing its fight against inflation? No, that is not the message of the two year, but rather a warning sign that if rates are cut too much more there is the risk of higher inflation on the horizon.
Other charts we shared with you this week were:
Monday, December 23: S&P 500 - Even a Big Down Day Does Not Shake the Index
Monday, December 23: Elastic NV ESTC - A Portfolio Holding Finds Its Way Back to Familiar Territory
Tuesday, December 24: American Express - Portfolio's American Express 'Membership' Has Its Privileges
Thursday, December 26: Labcorp - We're Eyeing This 'Test' for Labcorp
The Coming Week
We have another compressed week ahead, one that will see U.S. equity market closed on Wednesday for the New Year’s Day holiday. Unlike this week, we will have full trading days on Monday and Tuesday as well as on Thursday and Friday. We would not be surprised to see thin trading volumes throughout the week, but with the next set of fresh economic data being published late next week, odds are that we will see a pickup in market activity.
That data to watch will be the first half of December PMI data from S&P Global as well as ISM, better known as the Manufacturing PMI reports. The last several of these reports have painted a mixed picture of the domestic manufacturing economy, leading to modest downward revisions in rolling GDP models. November new order data found in ISM’s Manufacturing PMI report showed new export orders still below the expansion-contraction line at 50. That same report also found improving outlooks for the economy heading into 2025.
Should we see a stronger rebound in new order activity that would be another reason to think the economy will commence 2025 on firm footing. The double-edged sword in this is if that December Manufacturing PMI report and the soon-to-follow one for December Services PMI data show the economy is still humming, it would be another reason for the market to question the timing of the Fed’s next rate cut. Setting the stage for that data, the Atlanta Fed’s GDPNow model pegs Q4 2024 GDP at 3.1% and the CME FedWatch Tool shows just one rate cut in May 2025.
As we think about those figures, we’ll not only be watching new order data in the coming months but also what we see in December as well as Q1 2025 inflation data. That means drilling into the Prices sub-index in next week’s December Manufacturing PMI data and doing the same when we get the December Services PMI reports the following week.
Here's a closer look at the economic data coming at us next week:
U.S.
Monday, December 30
- Chicago PMI – December (9:45 AM ET)
- Pending Home Sales – November (10:00 AM ET)
Tuesday, December 31
- FHFA Housing Price Index – October (9:00 AM ET)
- S&P Case Shiller Home Price Index – October (9:00 AM ET)
Thursday, January 2
- MBA Mortgage Applications Index – Weekly (7:00 AM ET)
- Initial & Continuing Jobless Claims – Weekly (8:30 AM ET)
- S&P Global Manufacturing Index (Final) – December (9:45 AM ET)
- Construction Spending – November (10:00 AM ET)
- EIA Crude Oil Inventories – Weekly (10:30 AM ET)
Friday, January 3
- ISM Manufacturing Index – December (10:00 AM ET)
- EIA Natural Gas Inventories – Weekly (10:30 AM ET)
International
Monday, December 30
- Japan: Jibun Bank Manufacturing PMI (Final) – December
Tuesday, December 31
- China: NBS Manufacturing & Non-Manufacturing PMI - December
Wednesday, January 1
- China: Caixin Manufacturing PMI - December
Thursday, January 2
- Eurozone: HCBO Manufacturing PMI (Final) – December
- UK: S&P Global Manufacturing PMI (Final) - December
We have another light week ahead when it comes to corporate earnings reports, but we will continue to have our radars tuned for December quarter pre-announcements and their implications, if any, on our holdings.
Here's a closer look at the earnings reports coming at us next week:
Thursday, October 5
- Close: Resources Connection RGP
Friday, October 6
- Open: Greenbrier GBX.
Portfolio Investor Resource Guide
- Economic Data: Here's a List of Links to the Key Economic Data We Closely Watch
- Investing Terminology: 16 Key Terms Club Members Should Know
- 10-Ks: Want to Know About a Stock? Read the Company's Reports
- 10-Qs: Unlock the Numbers and Key Information Behind Your Stock With the 10-Q
- Income Statement -Our Cheat Sheet to Understanding This Financial Document
- Balance sheet, Cash Flow Statements, and Dividends - How to Know If a Company Is Off-Kilter? Read Its Balance Sheet
- Valuation Metrics - Everyone Wants a Value. Here's How Investors Can Find One
- Thematic Investing 101 Webinar
The Portfolio Ratings System
1 - Buy Now (BN): Stocks that look compelling to buy right now.
2 - Stockpile (SP): Positions we would add to on pullbacks or a successful test of technical support levels.
3 - Holding Pattern (HP): Stocks we are holding as we wait for a fresh catalyst to make our next move.
4 - Sell (S): Positions we intend to exit.
At the time of publication, TheStreet Pro Portfolio was long AXP, LMT, QCOM, LH, WM and ESTC.