Chart of the Day: We're Eyeing This 'Test' for Labcorp
The stock is catching support at a key level and may bounce nicely from there.
You've reached your free article limit
You've read 0 of 1 free Pro articles.
We recently picked up some more shares of Labcorp LH for the Pro Portfolio. Now, let's check the chart.
We're looking for the stock to test the 200-day moving average. It did not quite get there, but it did test the lower trend line (drawn on the top chart), which is near where the 100-day moving average resides (not shown). The 100-day moving average has served as a nice support level over the past few months.
The Moving Average Convergence Divergence indicator in the second pane is starting to turn up; it'll take a few more sessions of higher prices to get this indicator moved into the bull camp. Stochastics in the second-to-last pane are still on the move (up), showing some good momentum and strength in the stock. Money flow unfortunately remains bearish, but we'll be watching for better volume days when the stock moves higher, which should trigger a positive money flow.
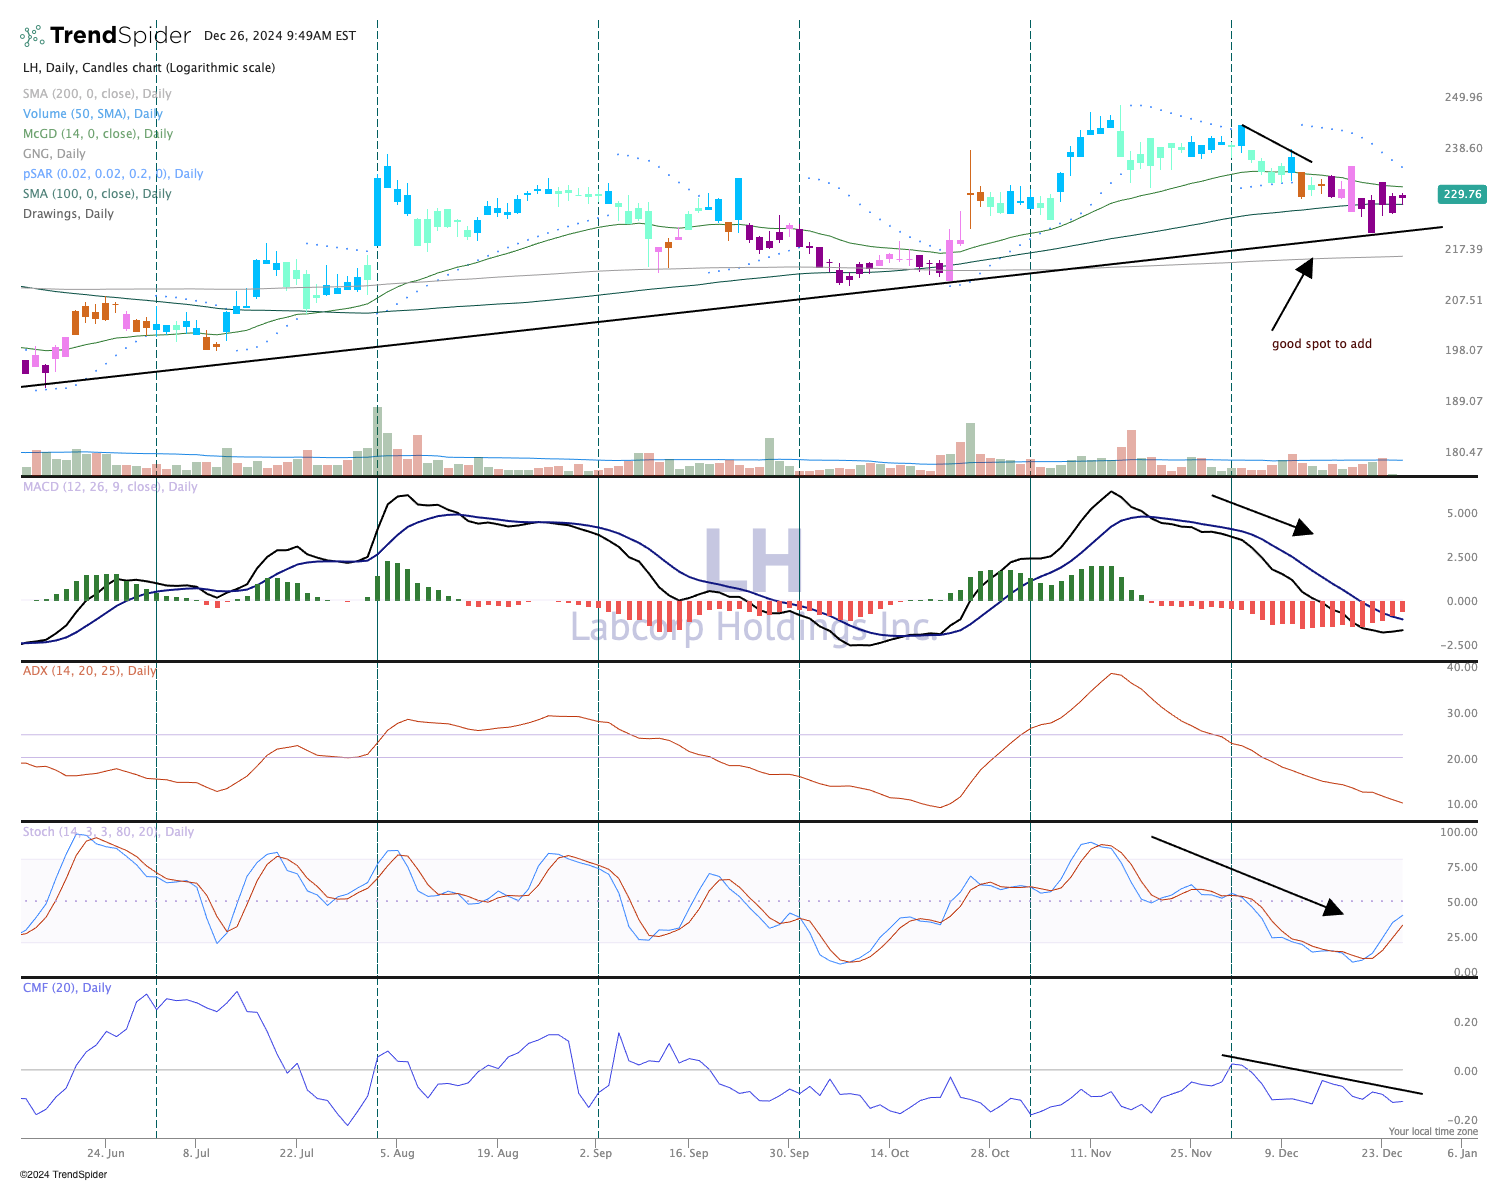
Certainly the price action remains bearish, but the candles are purple/pink, which is in the bearish camp. We are looking for a turn up though and see this testing of important support as a good buying opportunity.
We rate Labcorp a "Two" in TheStreet Pro Portfolio, stockpile on pullbacks.
The Pro Portfolio is long Labcorp.
